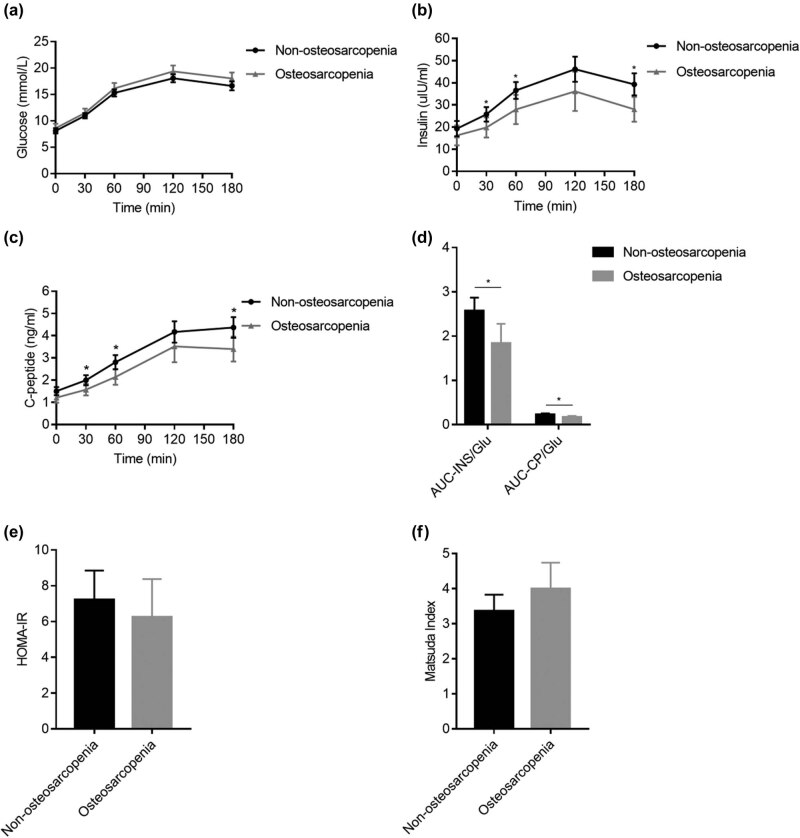
Figure 1.
Comparison of the levels of OGTT-induced serum glucose, insulin, C peptide, β-cell function, and insulin resistance status of the two groups. (a–c) Serum glucose (a), insulin (b), and C-peptide (c) during 180 min OGTT. (d) β-Cell function measured by AUC-Ins/Glu and AUC-CP/Glu. (e–f) Insulin resistance status measured by HOMA-IR (e) and Matsuda index (f). Each error bar is constructed using a 95% confidence interval of the mean. *P < 0.05 versus nonosteosarcopenia.

