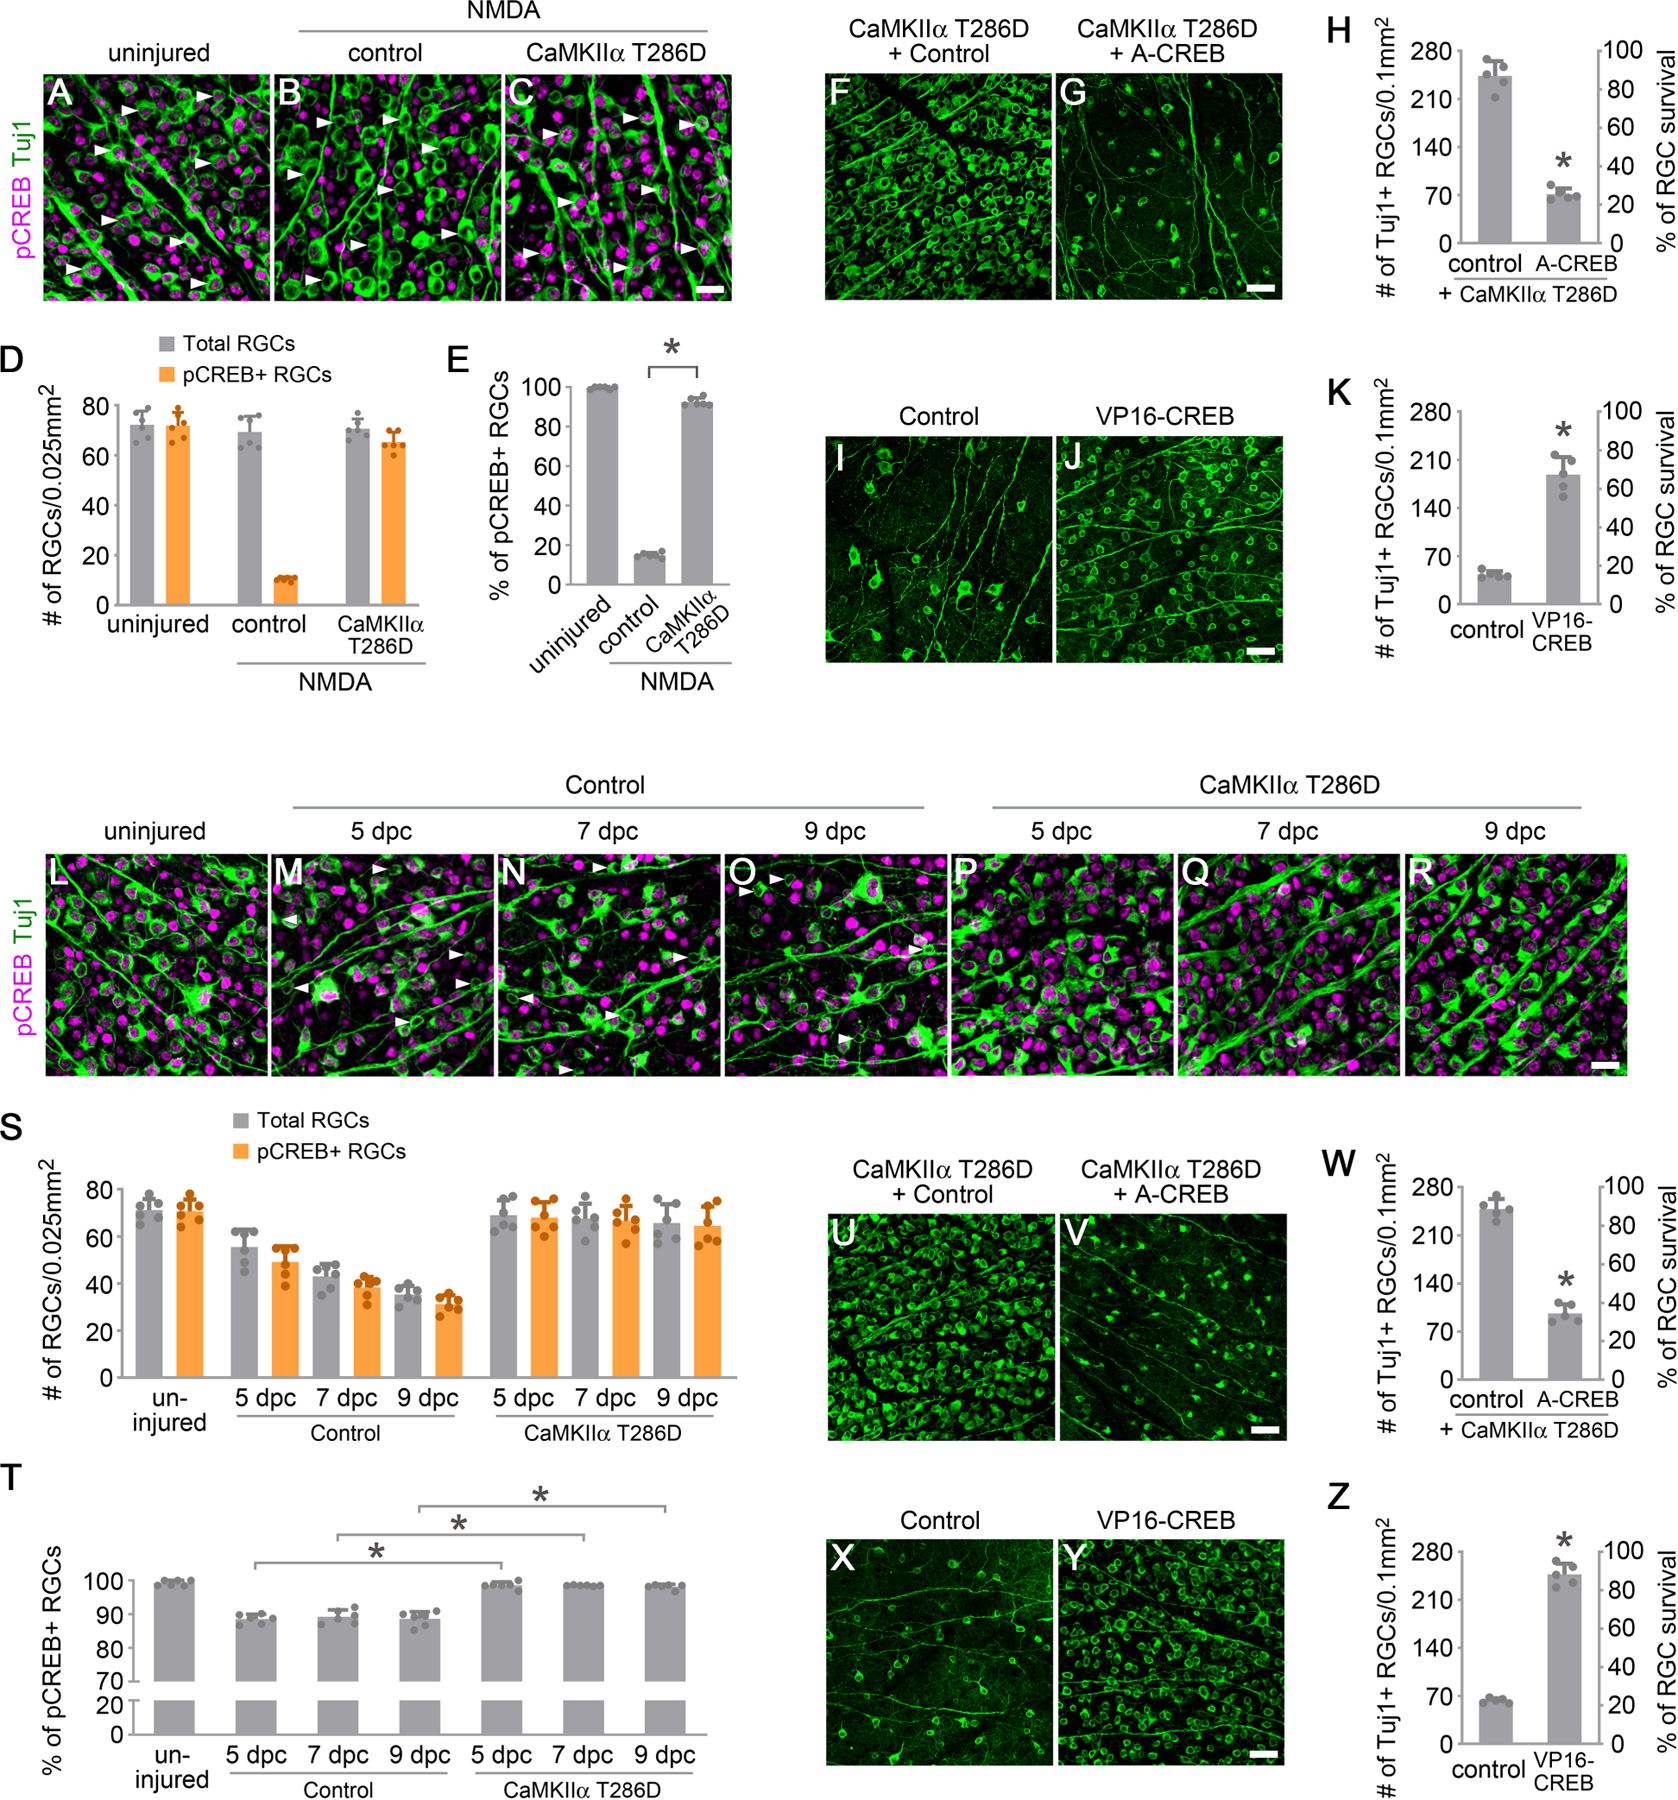
Figure 4. CREB acts downstream of CaMKII to protect RGCs from excitotoxic and optic nerve injuries.

(A-C) Confocal images of retinal whole-mounts showing CREB phosphorylation in RGCs, from uninjured eyes (A), and 2 hours after NMDA injection in control (AAV-EBFP) (B) or AAV-CaMKIIα T286D (C) treated eyes. Arrowheads, Tuj1+ RGCs maintaining (A) or losing (B) CREB activity, which was restored after treatment with CaMKIIα T286D (C). Scale bar, 20 µm.
(D-E) Quantification of CREB phosphorylation in RGCs 2 hours after NMDA-induced excitotoxic injury. (D) The number of total Tuj1+ RGCs and pCREB+/Tuj1+ RGCs in uninjured or NMDA-damaged eyes. Data are presented as mean ± s.d., n=6 retinas per group. (E) Percentage of pCREB+/Tuj1+ RGCs in uninjured or NMDA damaged eyes. Data are presented as mean ± s.d., n=6 retinas per group. One-way ANOVA with Tukey’s multiple comparisons test, F:6139, R2:0.9988, *P<0.0001.
(F-G) Confocal images of retinal whole-mounts showing surviving RGCs labeled by Tuj1 immunoreactivity at 7 days after NMDA injection in AAV-CaMKIIα T286D + Control (AAV-EBFP), or AAV-CaMKIIα T286D + AAV-A-CREB treated eyes. Scale bar, 40 µm. (H) Quantification of RGC survival, expressed as numbers of RGCs (left Y-axis), and percentages of RGCs relative to those in the uninjured retina (right Y-axis). Data are presented as mean ± s.d., n=5 retinas per group. Unpaired t-test, *P<0.0001.
(I-J) Confocal images of retinal whole-mounts showing surviving RGCs labeled by Tuj1 immunoreactivity at 7 days after NMDA injection in control (AAV-EBFP) or AAV-VP16-CREB treated eyes. Scale bar, 40 µm. (K) Quantification of RGC survival. Data are presented as mean ± s.d., n=5 retinas per group. Unpaired t-test, *P<0.0001.
(L-R) Confocal images of retinal whole-mounts showing CREB phosphorylation in RGCs, from uninjured eyes (L), and 5 days, 7 days and 9 days after optic nerve crush in control (AAV-EBFP) (M-O) or AAV-CaMKIIα T286D (P-R) treated eyes. Arrowheads, Tuj1+ RGCs losing CREB activity (M-O). Scale bar, 20 µm.
(S-T) Quantification of CREB phosphorylation in RGCs after optic nerve injury. (S) The number of total Tuj1+ RGCs and pCREB+/Tuj1+ RGCs in uninjured and injured retinas 5 days, 7days, and 9 days after crush. Data are presented as mean ± s.d., n=6 retinas per group. (T) Percentage of pCREB+/Tuj1+ RGCs in uninjured and injured retinas 5 days, 7days, and 9 days after crush. Data are presented as mean ± s.d., n=6 retinas per group. One-way ANOVA with Tukey’s multiple comparisons test, F:89.58, R2:0.9389, *P<0.0001.
(U-V) Confocal images of retinal whole-mounts showing surviving RGCs labeled by Tuj1 immunoreactivity at 2 weeks after optic nerve crush in AAV-CaMKIIα T286D + Control (AAV-EBFP), or AAV-CaMKIIα T286D + AAV-A-CREB treated eyes. Scale bar, 40 µm. (W) Quantification of RGC survival. Data are presented as mean ± s.d., n=5 retinas per group. Unpaired t-test, *P<0.0001.
(X-Y) Confocal images of retinal whole-mounts showing surviving RGCs labeled by Tuj1 immunoreactivity at 2 weeks after optic nerve crush in control (AAV-EBFP) or AAV-VP16-CREB treated eyes. Scale bar, 40 µm. (Z) Quantification of RGC survival. Data are presented as mean ± s.d., n=5 retinas per group. Unpaired t-test, *P<0.0001.
See also Figure S4.
