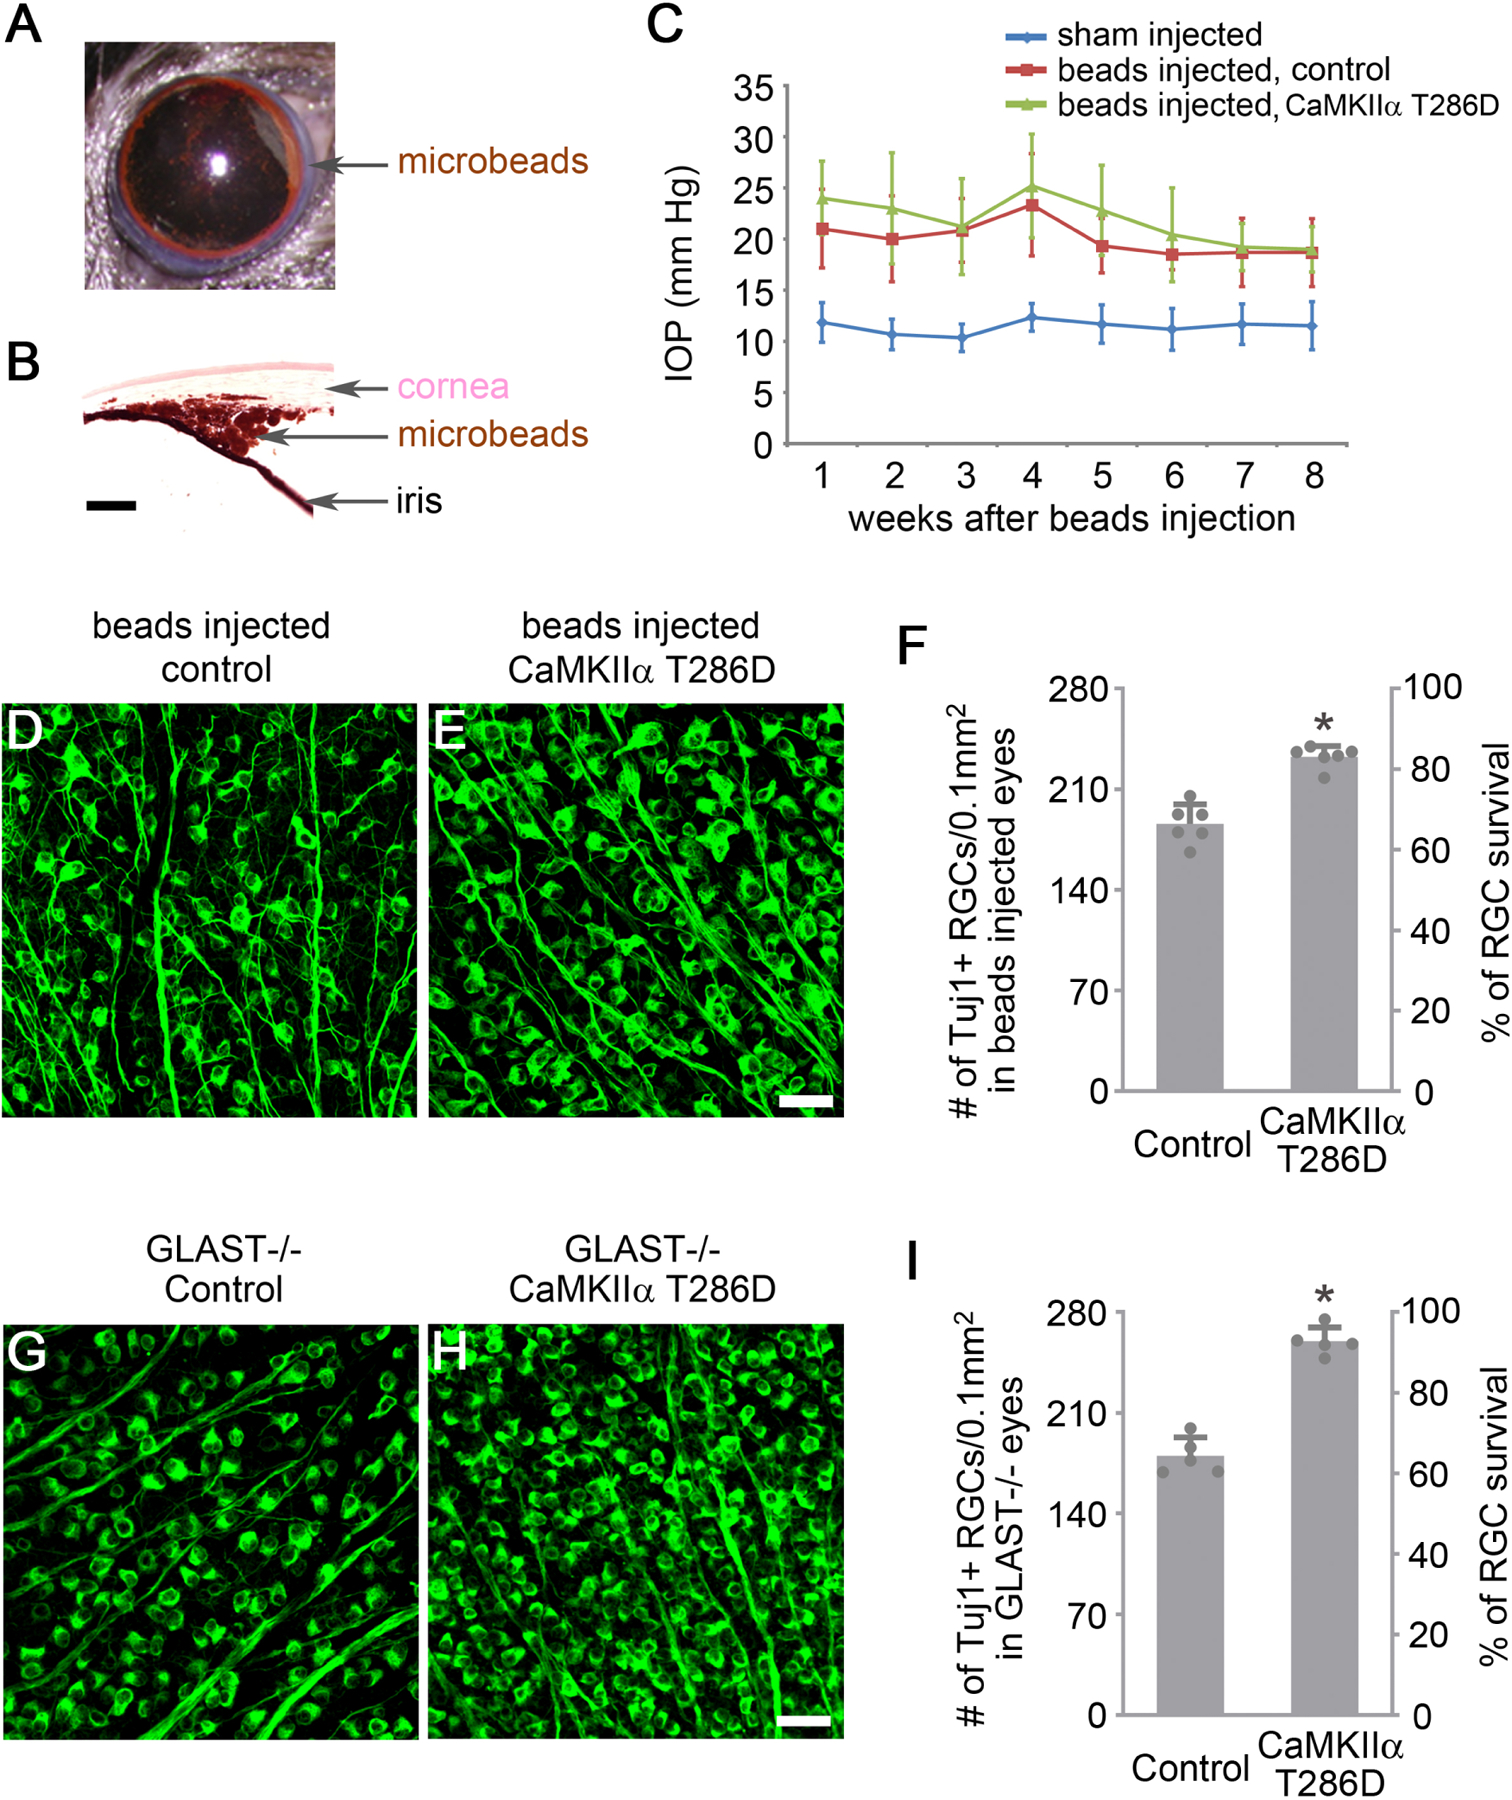
Figure 5. CaMKII-mediated protection of RGCs in induced and genetic models of glaucoma.

(A) Image of magnetic microbeads distributed evenly around the circumference of the anterior chamber using magnets after injection.
(B) Image of the eye section after H&E staining shows microbeads accumulation at the iridocorneal angle. Scale bar, 100 µm.
(C) Quantification of intraocular pressure (IOP) after injection of PBS (sham) or microbeads. Data are presented as mean ± s.d., n=6 eyes per group.
(D-E) Confocal images of retinal whole-mounts showing surviving RGCs labeled by Tuj1 immunoreactivity at 2 months after induction of elevated IOP in Control (AAV-EBFP) or AAV-CaMKIIα T286D treated eyes. Scale bar, 40 µm.
(F) Quantification of RGC survival, expressed as numbers of RGCs (left Y-axis), and percentages of RGCs relative to those in the uninjured retina (right Y-axis). Data are presented as mean ± s.d., n=6 retinas per group. Unpaired t-test, *P<0.0001.
(G-H) Confocal images of retinal whole-mounts from 2-month-old GLAST−/− mice showing surviving RGCs labeled by Tuj1 immunoreactivity in Control (AAV-EBFP) or AAV-CaMKIIα T286D treated eyes. Scale bar, 40 µm.
(I) Quantification of RGC survival in GLAST−/− retinas, expressed as numbers of RGCs (left Y-axis), and percentages of RGCs relative to those in the uninjured wild-type retina (right Y-axis). Data are presented as mean ± s.d., n=5 retinas per group. Unpaired t-test, *P<0.0001.
See also Figure S5.
