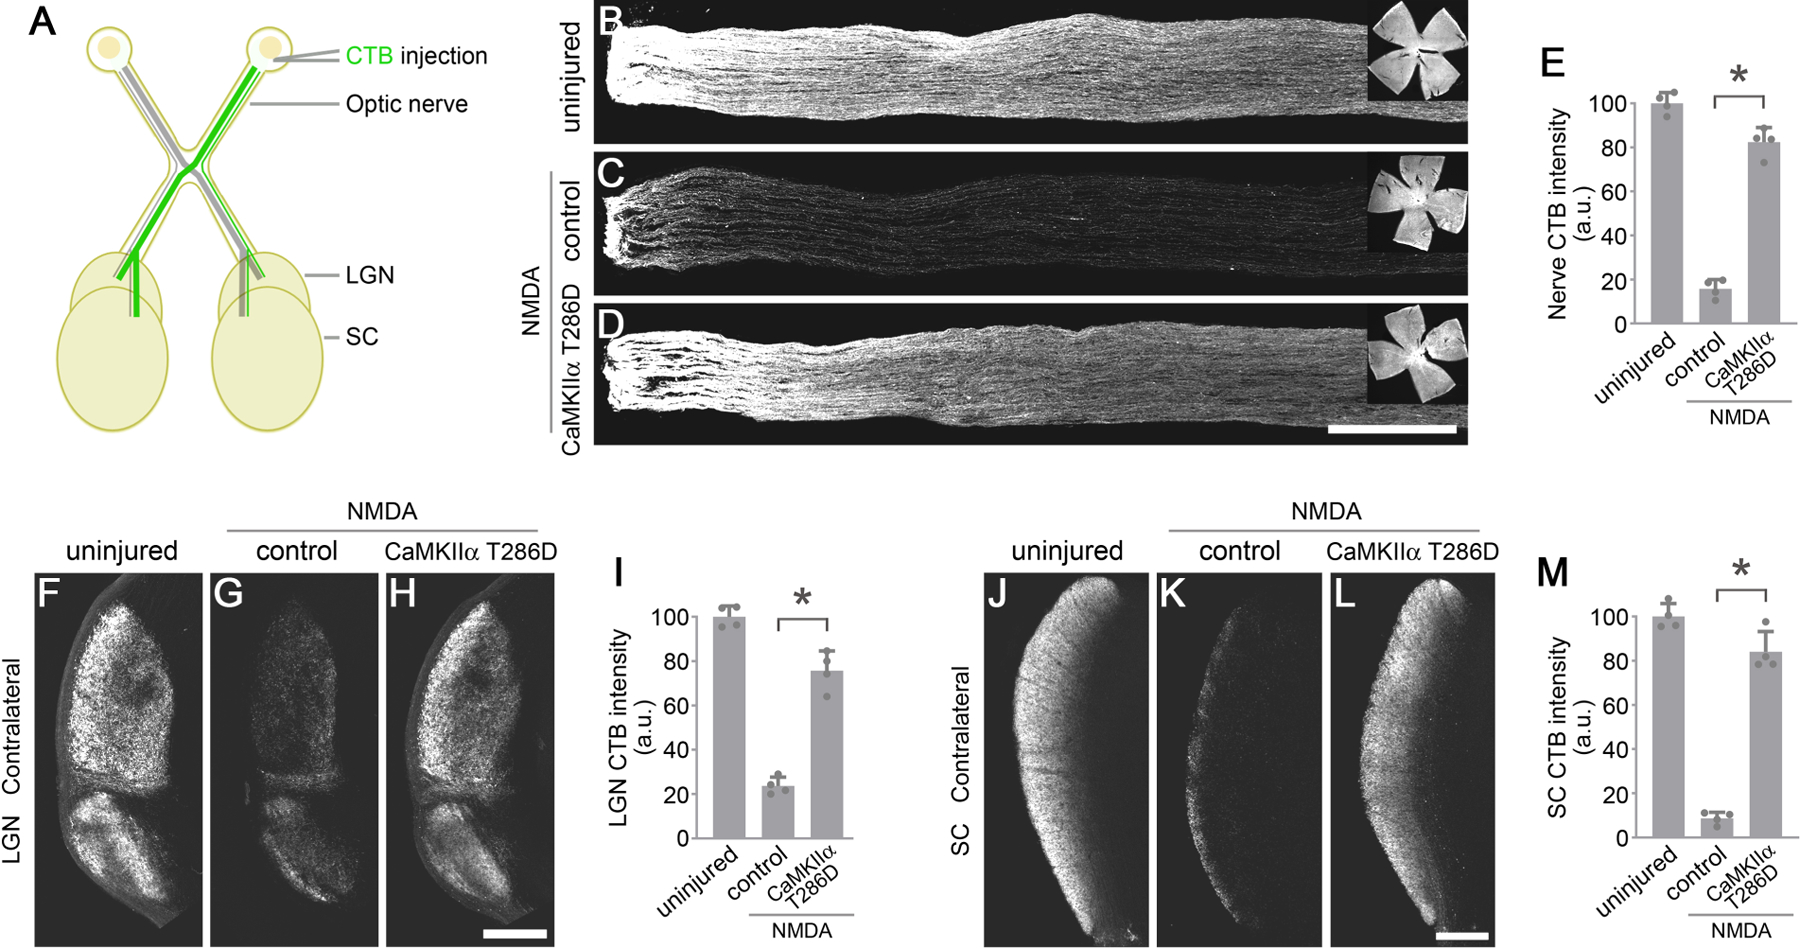
Figure 6. CaMKII reactivation protects RGC axons and their target projections to the brain.

(A) Schematic illustration of anterograde Cholera Toxin Subunit B (CTB) tracing of the optic nerve, lateral geniculate nucleus (LGN), and superior colliculus (SC).
(B-D) Confocal images of anterograde CTB tracing of RGC axons in the optic nerve, from uninjured eyes, and 7 days after NMDA injection in control (PBS) or AAV-CaMKIIα T286D treated eyes. Scale bar, 300 µm. Inserts: whole-mount retinal images showing CTB filling in the retina. (E) Quantification of CTB intensity in the optic nerve. Data are presented as mean ± s.d., n=4 nerves per group. One-way ANOVA with Tukey’s multiple comparisons test, F:281.7, R2:0.9843, *P<0.0001.
(F-H) Confocal images of anterograde CTB tracing of RGC axons projecting to the contralateral LGN from uninjured eyes, and 7 days after NMDA injection in control (PBS) or AAV-CaMKIIα T286D treated eyes. Scale bar, 300 µm. (I) Quantification of CTB intensity in the contralateral LGN. Data are presented as mean ± s.d., n=4 brains per group. One-way ANOVA with Tukey’s multiple comparisons test, F:155.8, R2:0.9719, *P<0.0001.
(J-L) Confocal images of anterograde CTB tracing of RGC axons projecting to the contralateral SC, from uninjured eyes, and 7 days after NMDA injection in control (PBS) or AAV-CaMKIIα T286D treated eyes. Scale bar, 300 µm. (M) Quantification of CTB intensity in the contralateral LGN. Data are presented as mean ± s.d., n=4 brains per group. One-way ANOVA with Tukey’s multiple comparisons test, F:226.9, R2:0.9805, *P<0.0001.
See also Figure S6.
