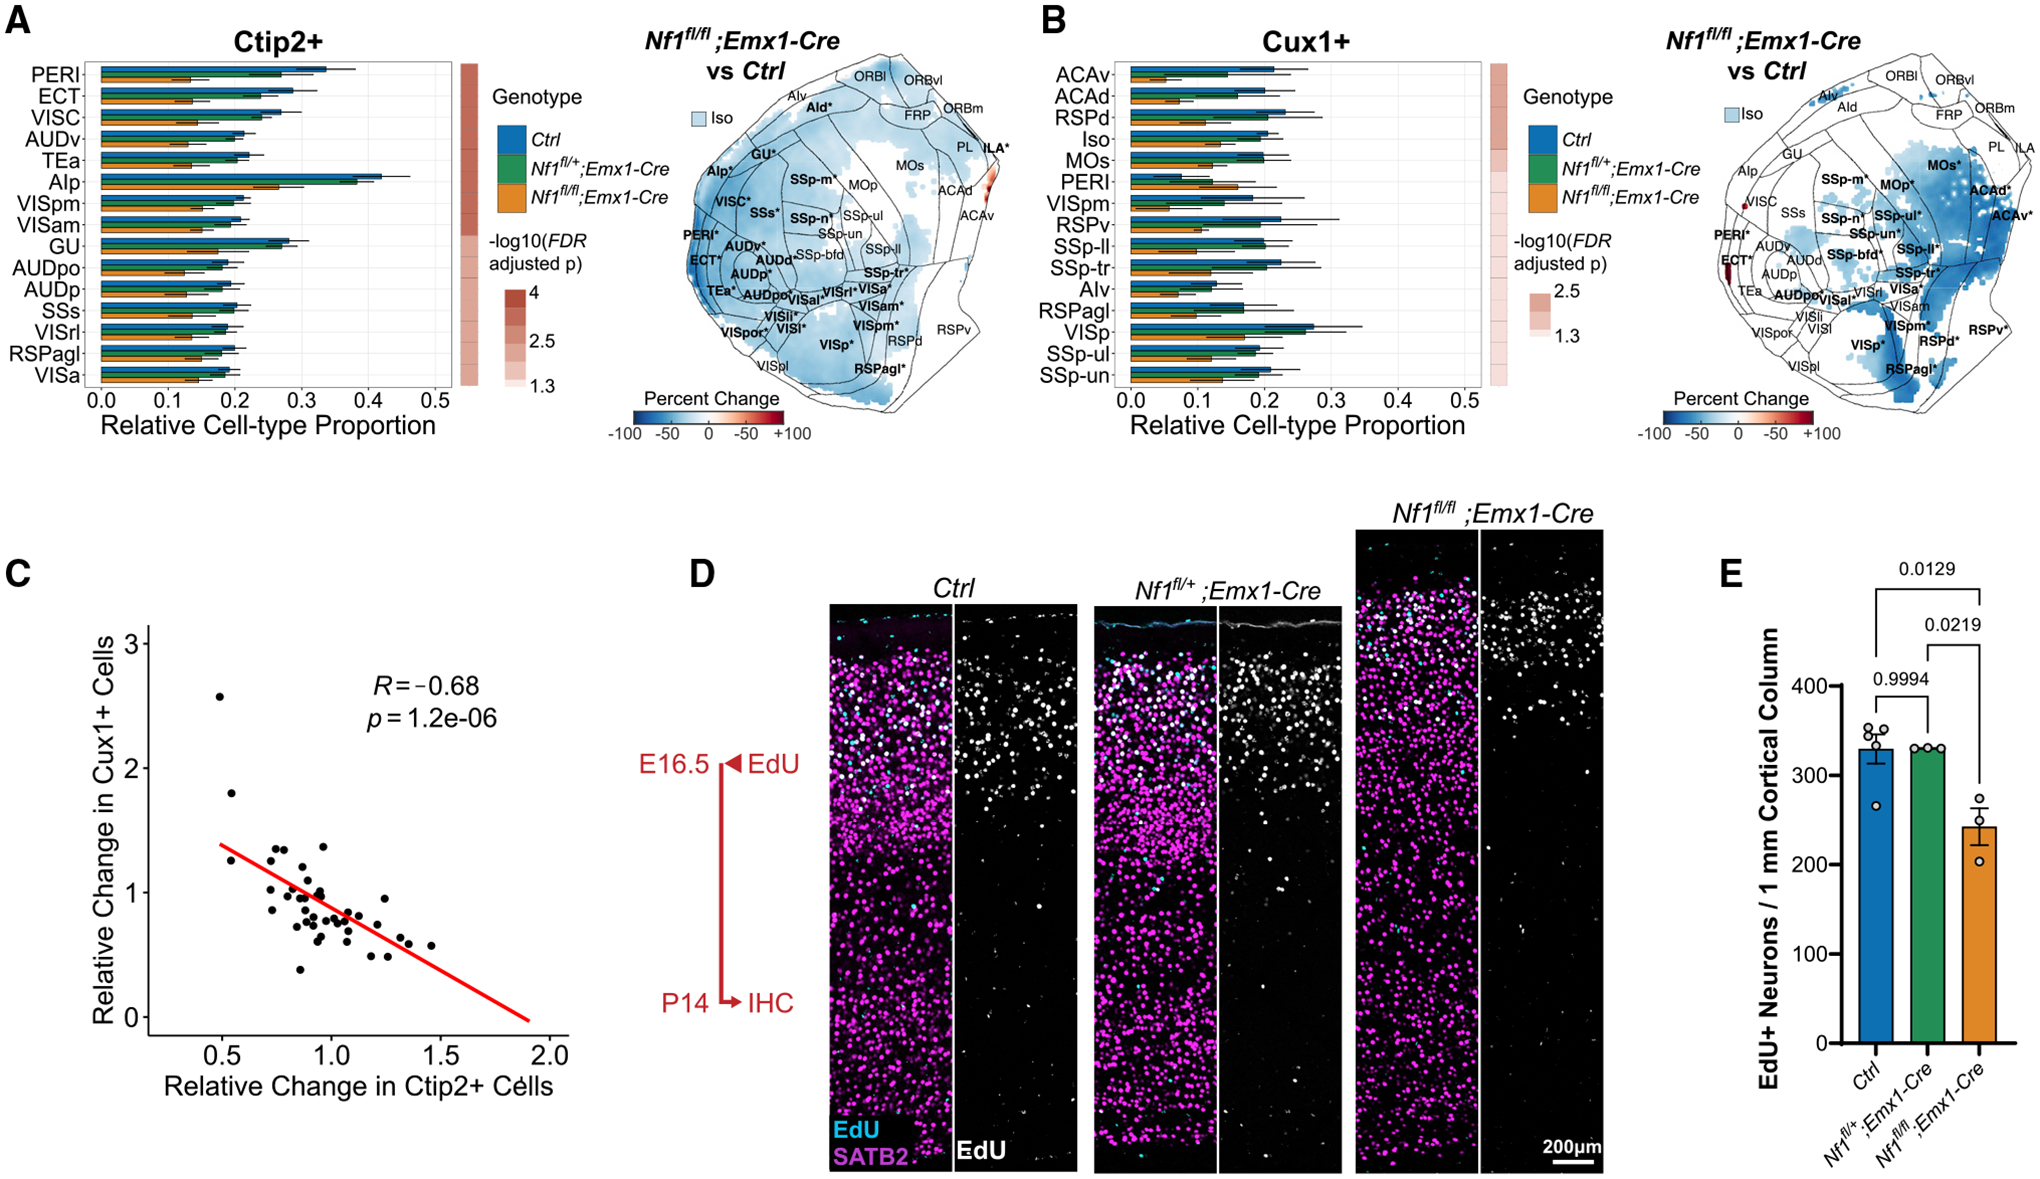
Figure 7. Nf1 deletion alters neuronal cell-type proportions in a region-specific manner.

(A and B) Differences in relative proportion of Ctip2+ (A) and Cux1+ (B) cells across 43 cortical regions and the full isocortex after Nf1 deletion. The top 15 structures sorted by binned p value and fold change are shown (Nf1fl/fl;Emx1-Cre versus Ctrl, mean ± SD, FDR < 0.05). Flattened isocortex displaying percentage change in Nf1fl/fl;Emx1-Cre versus Ctrl are shown on the right. Only significant pixels are colored, and significant regions are bolded and starred (FDR < 0.05).
(C) Association between relative change in Ctip2+ and Cux1+ cell numbers across cortical regions in the Nf1fl/fl;Emx1-Cre.
(D) Representative 2D sections of 1 mm cortical columns from P14 somatosensory cortex after EdU injection at E16.5 showing colocalization with SATB2 (callosal projection neurons) immunolabeling in upper layers. Scale bar, 200 μm.
(E) Quantification of EdU+/SATB2+ cells within 1 mm cortical columns in (D) (n = 3–5 animals, mean ± SEM).
