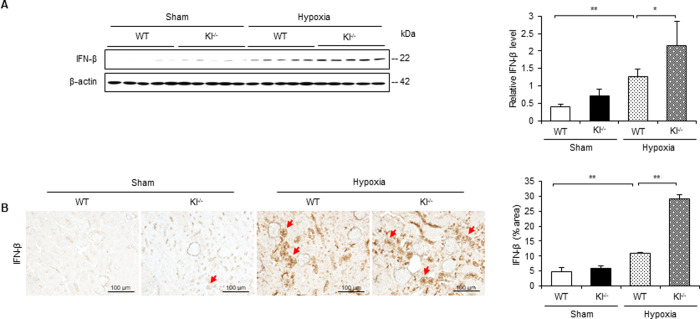
Fig 7. IFN-β is increased under hypoxic conditions in Kl−/− mice.
(A) Western blot analysis demonstrating IFN-β expression in WT and Kl−/− mice. Protein levels were normalized to β-actin levels (n = 5 in each group). (B) Representative immunohistochemical staining images showing IFN-β expression in WT and Kl−/− mice. Values are mean ± SD. *P < 0.05, **P < 0.01. Bar = 100 μm.

