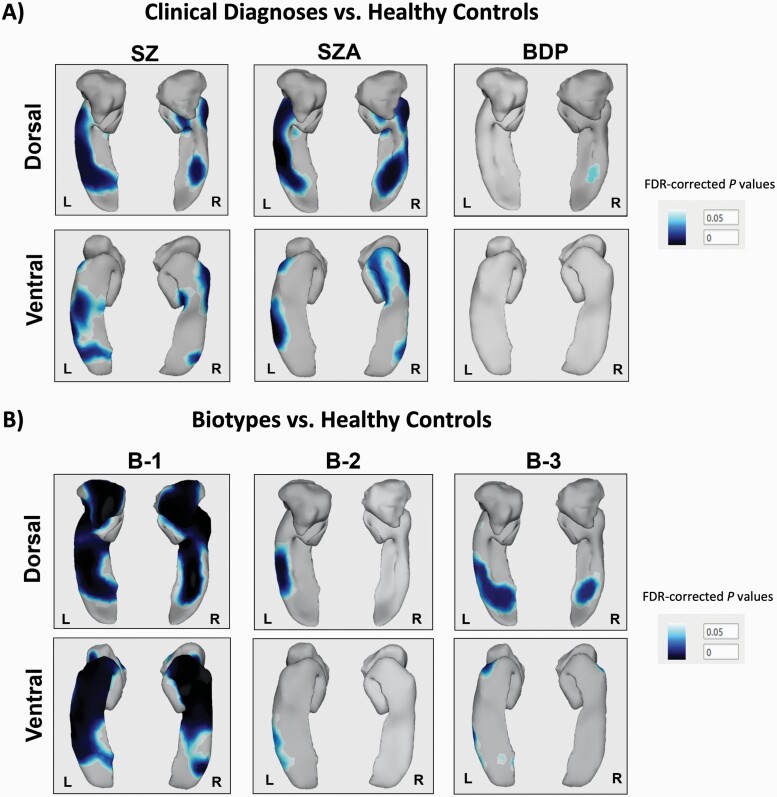
Fig. 3.
Significant surface shape deformation for the left and right amygdala and hippocampus for each group of probands compared with healthy controls. Darker regions represent significant surface-based deformations (ie, smaller surfaces, false discovery rate corrected) observed in psychosis cases when compared with healthy controls. HC, healthy controls (n = 330); SZ, schizophrenia (n = 199); SZA, schizoaffective disorder (n = 122); BDP, bipolar disorder with psychosis (n = 160); B-1, Biotype-1 (n = 121); B-2, Biotype-2 (n = 161); B-3, Biotype-3 (n = 199).

