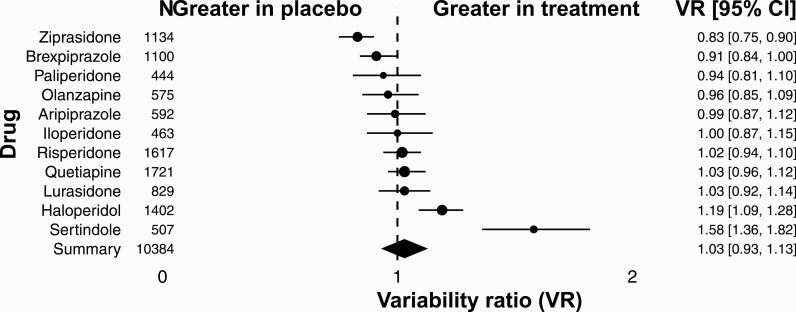
Fig. 3.
Variability ratio for QTC prolongation for individual antipsychotics. The forest plot shows the VR together with its 95% confidence interval (CI) for treatment versus placebo. All included studies42,45,51,52,54–60,62,68,70,74,76–80,85,86,88,91,95,97,101,104,105 are also listed in supplementary table S1.

