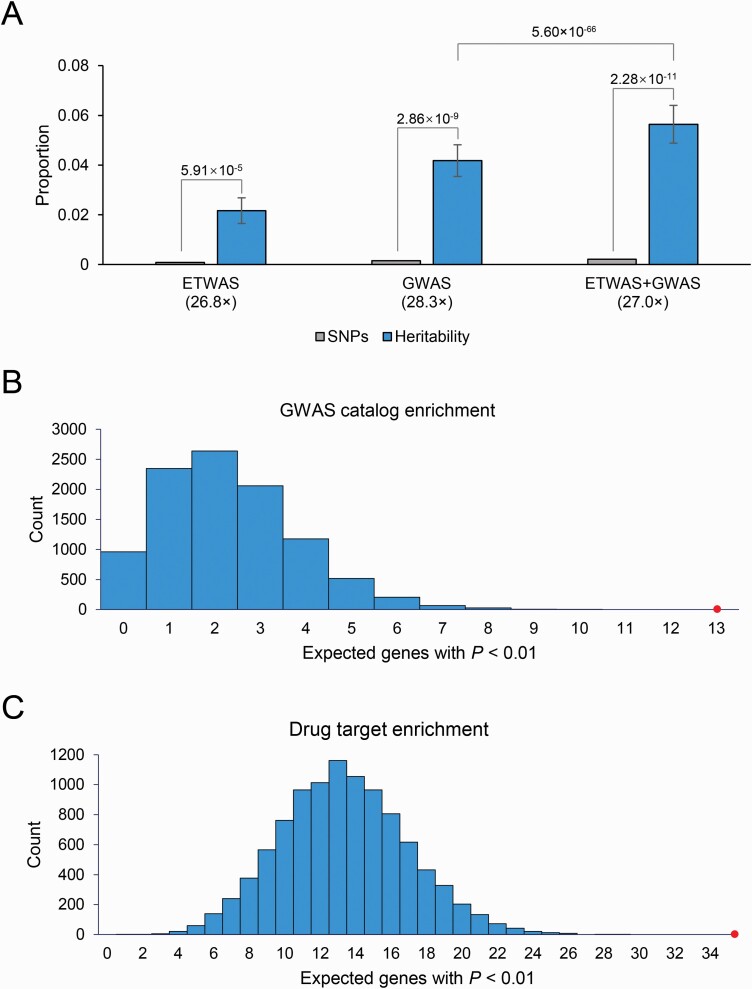
Fig. 4.
(A) Partitioned heritability of conditionally independent genes and GWAS loci. The null expectation, equal to the percentage of SNPs in each category (light gray), and P-values report the difference from this expectation. Fold enrichment relative to the null expectation is shown in parentheses below each category. Error bars show standard errors. (B) GWAS catalog enrichment analyses of ETWAS genes. (C) Drug targets enrichment analyses of ETWAS genes. The 2 histograms show the expected number of genes with P < 0.01 based on 10 000 random permutations. The large points show the observed number of previously known BD genes/targets that fall below this threshold. For color, please see the figure online.

