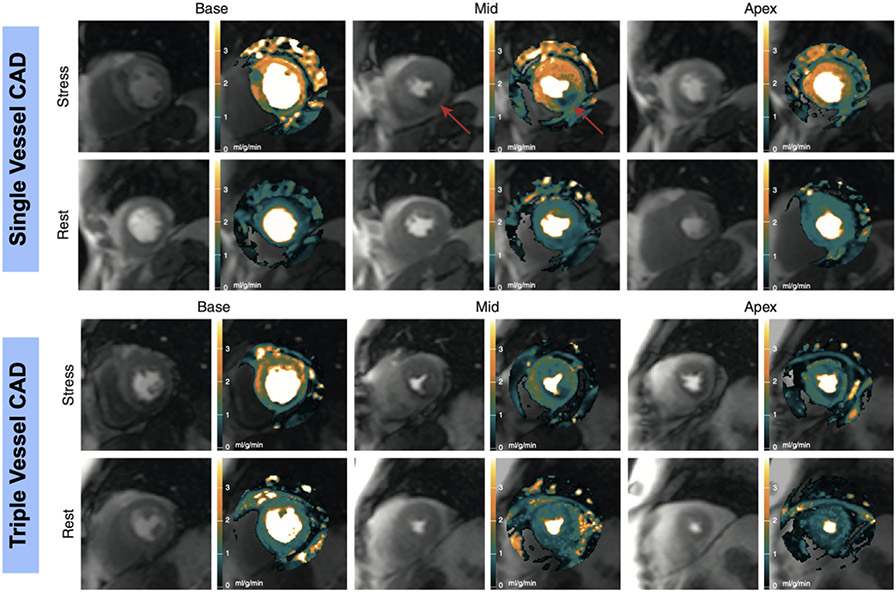
Figure 6. Quantitative Assessment of Myocardial Perfusion.
Top two rows: Quantitative myocardial blood flow maps and perfusion images from patient with single vessel coronary artery disease. Arrow denotes region ischemic myocardium. Bottom two rows: Myocardial blood flow maps and perfusion images from patient with multi-vessel coronary artery disease. Resting myocardial blood flow is approximately 1ml/g/min and remains low throughout the myocardium during stress. Adapted from Hsu LY, Jacobs M, Benovoy M et al. Diagnostic Performance of Fully Automated Pixel-Wise Quantitative Myocardial Perfusion Imaging by Cardiovascular Magnetic Resonance. JACC Cardiovasc Imaging 2018;11:697-707.

