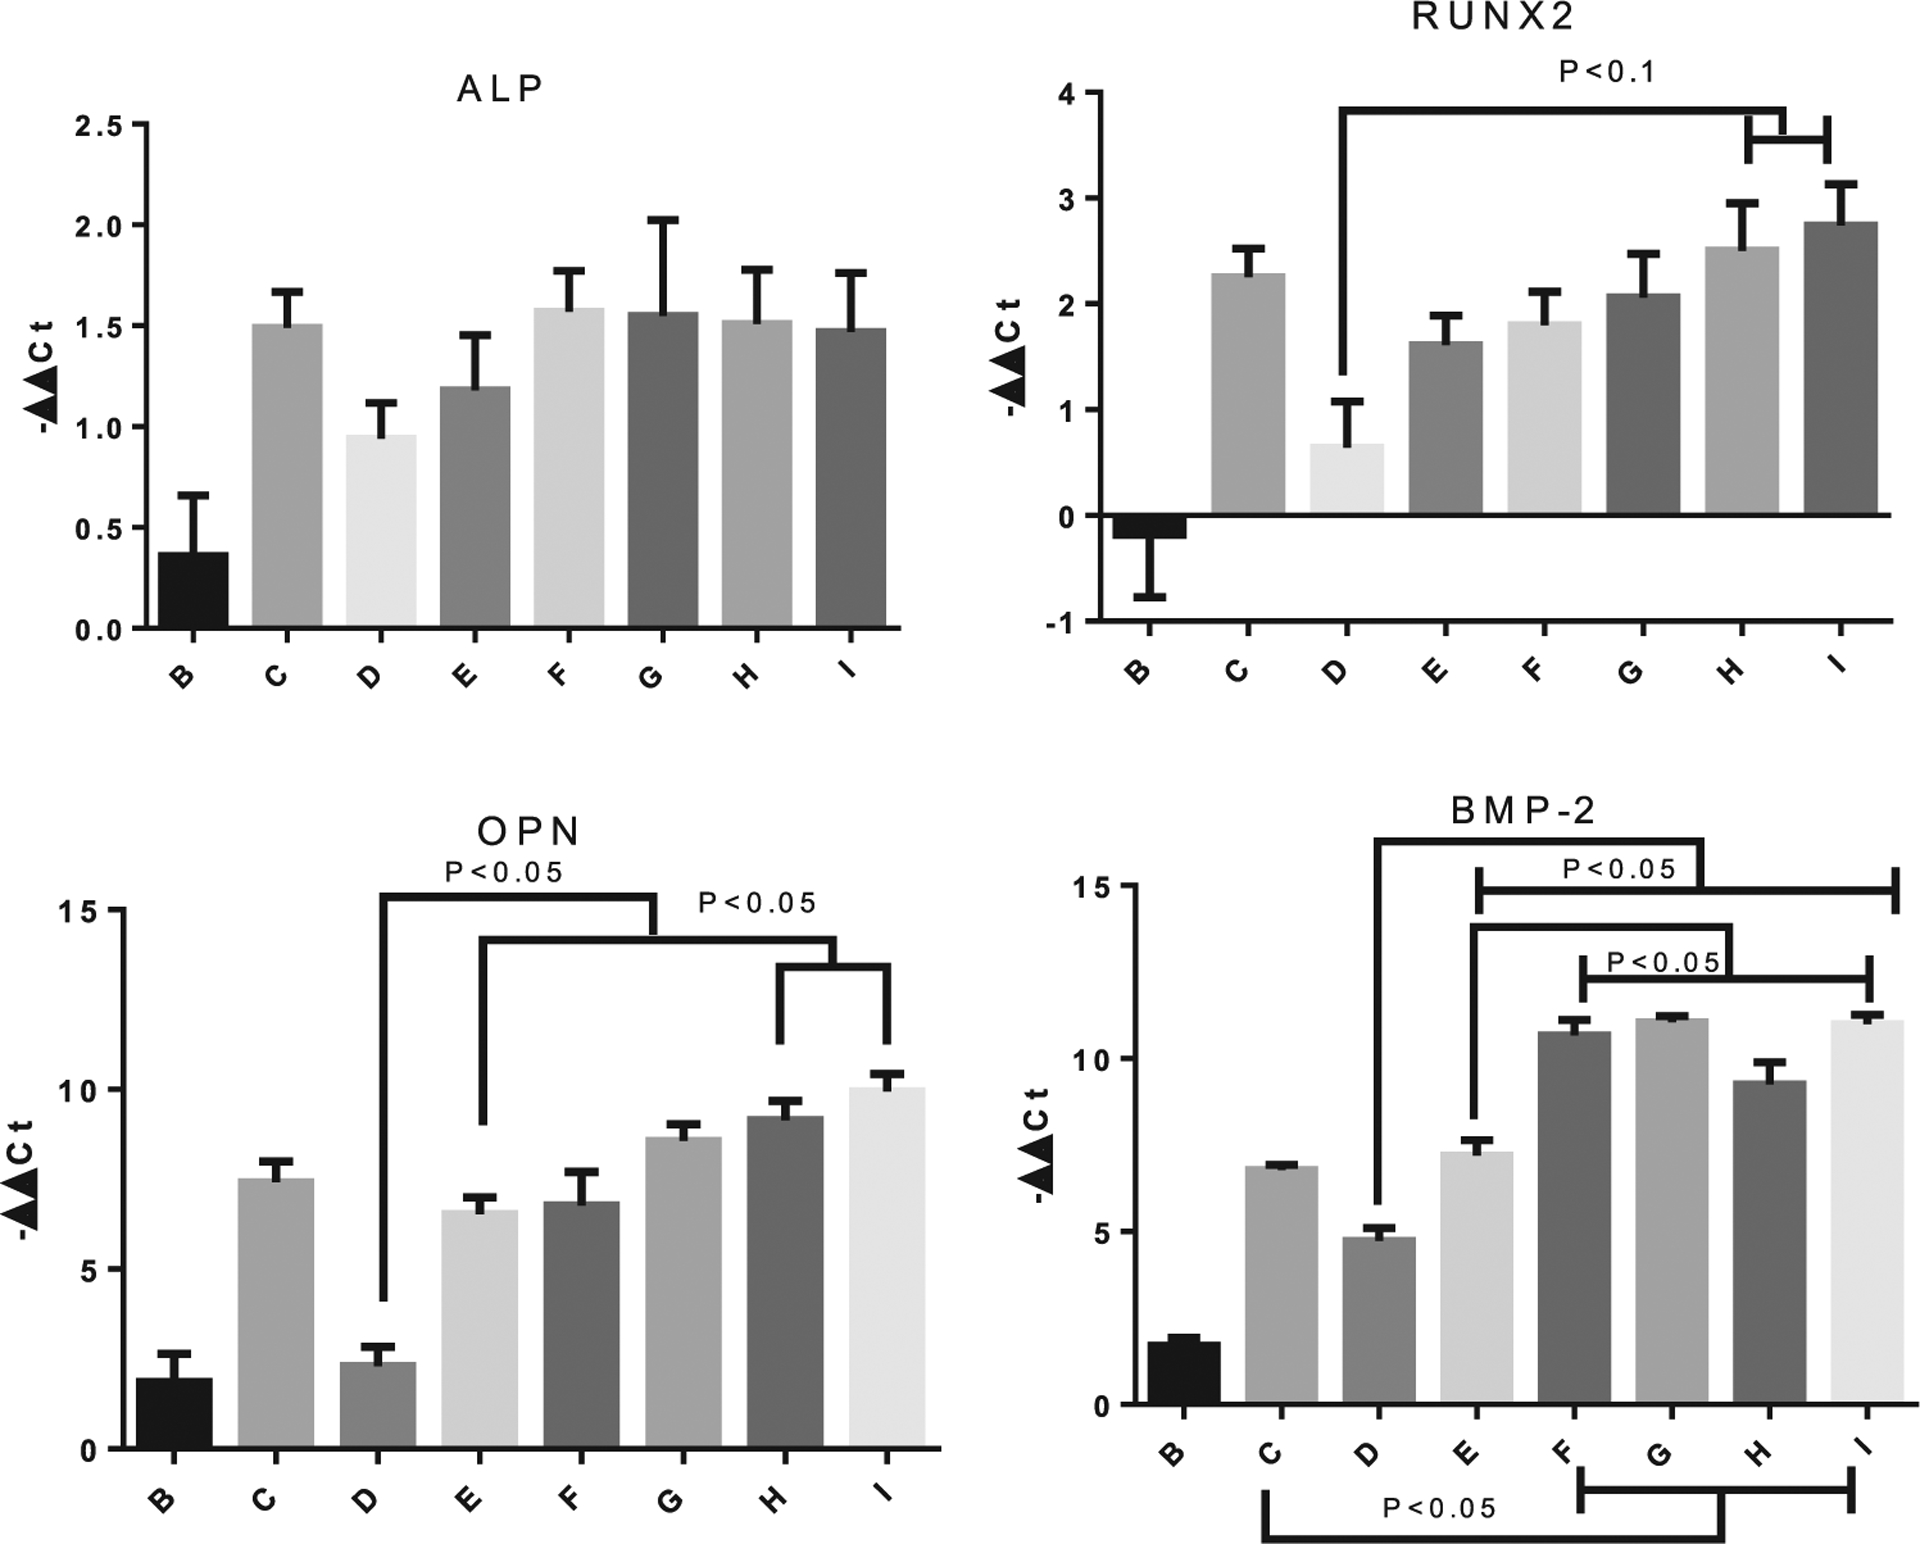
Figure 6.

Days 7 and 21 PCR results. ALP expression was measured at day 7, while Runx2, OPN, and BMP-2 were measured at day 21. The legends indicate the different samples as follows: B = miR-21-SNPs and miR-148b-GNPs without activation; C = Osteogenic differentiation media control; D = miR148-GNPs light activated at 530 nm 16 h post-transfection; E = miR-21-SNPs and miR-148b-GNPs, light activated at 405 and 530 nm wavelengths of light, simultaneously, 16 h after transfection; F = miR-21-SNPs and miR-148b-GNPs, light activated at 405 nm 16 h post-transfection, followed by 530 nm at 40 h; G = miR-21-SNPs and miR-148b-GNPs, light activated at 530 nm 16 h post-transfection, followed by 405 nm at 40 h; H = miR-21-SNPs and miR-148b-GNPs, light activated at 405 nm 16 h post-transfection, followed by 530 nm at 64 h; I = miR-21-SNPs and miR-148b-GNPs, light activated at 530 nm 16 h post-transfection, followed by 405 nm at 64 h.
