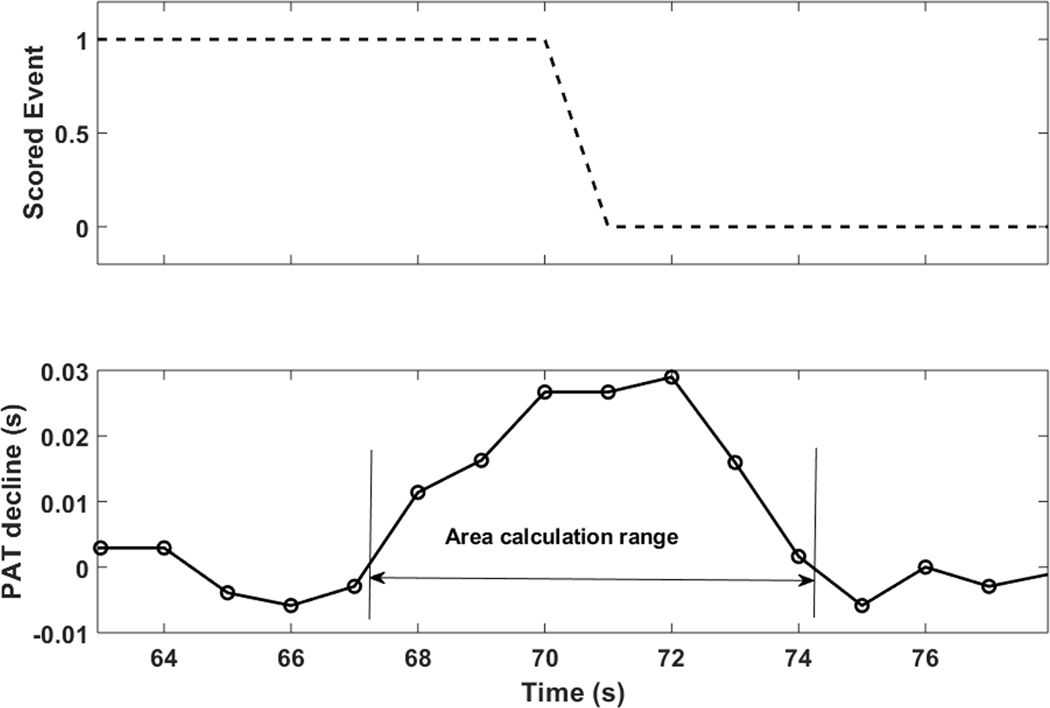
Figure 3.
An example of PAT response to a respiratory event (top panel). ‘1’ denotes ongoing an apneic or hypopneic event. “0” denotes termination of an apneic or hypopneic event. After determining “significant” PAT declines, an individual event-related PAT response was defined as the area under the PAT decline curve from the later of the immediate local minimum or zero crossing before the peak to the sooner of the immediate local minimum or zero crossing after the peak (bottom panel). The PAT response was defined as the mean value of all significant areas in each participant. PAT, pulse arrival time.

