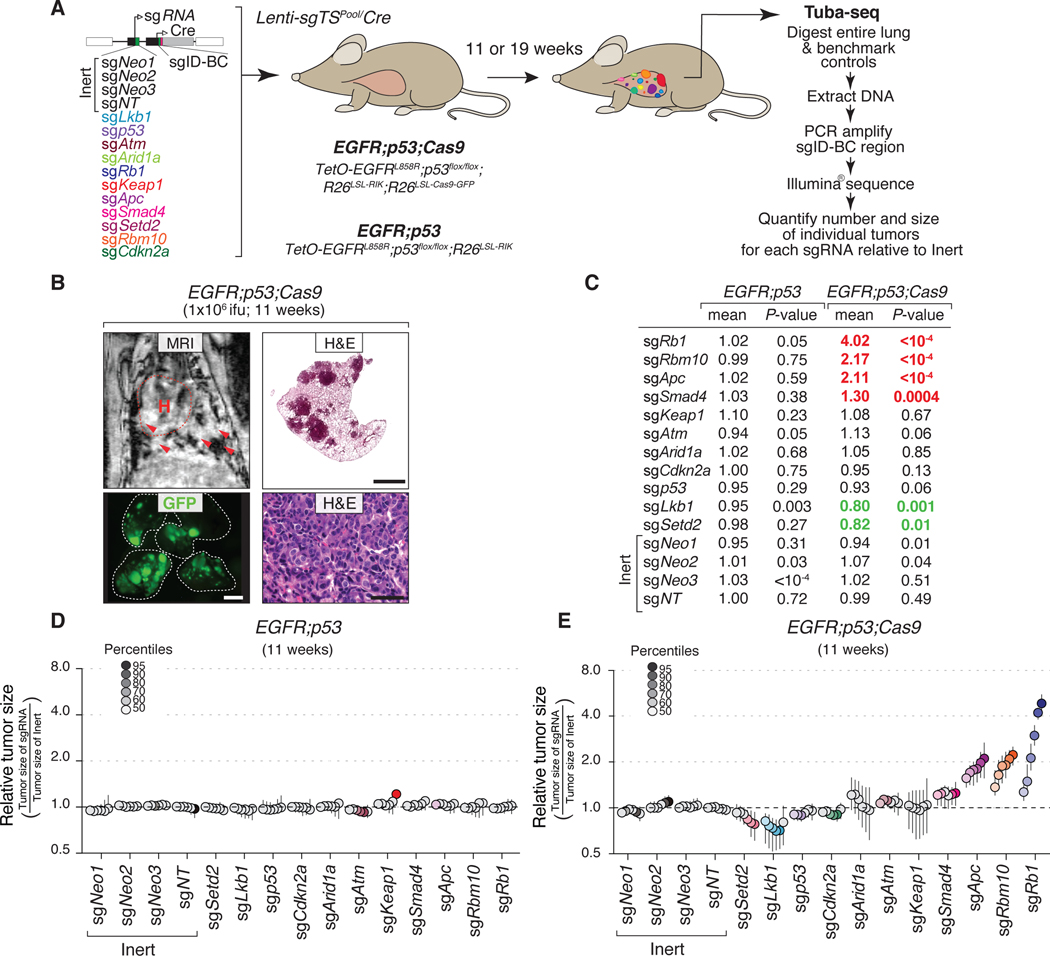
Figure 2. Multiplexed somatic CRISPR–Cas9-mediated genome editing uncovers tumor suppressor gene effects on EGFR-driven lung tumors.
A. Experimental strategy. Tumors were allowed to develop for either 11 weeks in EGFR;p53;Cas9 and EGFR;p53 mice or 19 weeks in EGFR;p53;Cas9 mice after intra-tracheal administration of Lenti-sgTSPool/Cre. Whole lungs were collected for tumor barcode deep sequencing (Tuba-seq) and histology. The number of neoplastic cells in each tumor (tumor size) was calculated from barcode sequencing of bulk tumor-bearing lungs. Barcode read number was normalized to benchmark control cells that have known barcodes and were added at a known number to each sample (Supplementary Methods).
B. MRI, H&E, and GFP images showing tumor development in EGFR;p53;Cas9 mice 11 weeks after tumor initiation with 1×10⁶ ifu of Lenti-sgTSPool/Cre. H&E image scale bars = 1.2 mm and 100 μm in top and bottom right panels, respectively. Lungs are indicated by the white dashed lines. GFP image scale bar = 2.5 mm. Images are from a representative mouse (N = 10).
C. Relative log-normal (LN) mean size of tumors with each sgRNA in EGFR;p53 (N = 5) and EGFR;p53;Cas9 mice (N = 10) 11 weeks after tumor initiation (normalized to the tumors with inert sgRNAs). P-values were calculated from bootstrapping. P-values < 0.05 and their corresponding means are highlighted in EGFR;p53;Cas9 mice for sgRNAs that positively (red) and negatively (green) affect tumor growth when the effects are equal to or differ >10% compared to the size of tumors with inert sgRNAs.
D. Relative size of tumors at the indicated percentiles of each genotype in EGFR;p53 mice 11 weeks after tumor initiation with the Lenti-sgTSPool/Cre. These mice lack the R26LSL-Cas9-GFP allele; therefore, all sgRNAs are functionally inert. 95% confidence intervals are shown. Percentiles calculated from bootstrapping that are significantly different from the tumors with inert sgRNAs are in color.
E. Relative size of tumors of each genotype in EGFR;p53;Cas9 mice 11 weeks after tumor initiation with the Lenti-sgTSPool/Cre. The relative size of tumors at the indicated percentiles were calculated from the tumor size distribution of all tumors from ten mice. 95% confidence intervals are shown. Percentiles were calculated from bootstrapping and are in color if significantly different from the tumors with inert sgRNAs.

