
Figure 1. Telomere content and related genomic features across human cell lines.
Cell lines were grouped by cancer type and ordered by telomere content within each type, and are displayed such that each column represents a cell line. Telomere content measurements reflect combined z-scored estimates derived from CCLE WGS and GDSC WES with means for samples with telomere content estimates from both sources. Bars within each cancer type represent medians. Relative copy number values are shown as log2(relative to ploidy + 1)–1. Cell lines shown are filtered such in addition to annotations for telomere content, values for TERT and TERC RNA-seq expression, TERT and TERC copy number, and ATRX and DAXX mutation status are all available (with an exception made for non-cancerous cell lines, which lack such profiling in DepMap). Cell lines were also filtered such that each cancer type is represented by at least 10 cell lines (n = 738 cell lines total). RNA expression estimates are in terms of log2(TPM+1). CNS: central nervous system; PNS, peripheral nervous system; UADT, upper aerodigestive tract.

Figure 1—figure supplement 1. Overlap between cell lines represented in annotations.

Figure 1—figure supplement 2. Telomere content agreement between sequencing sets.
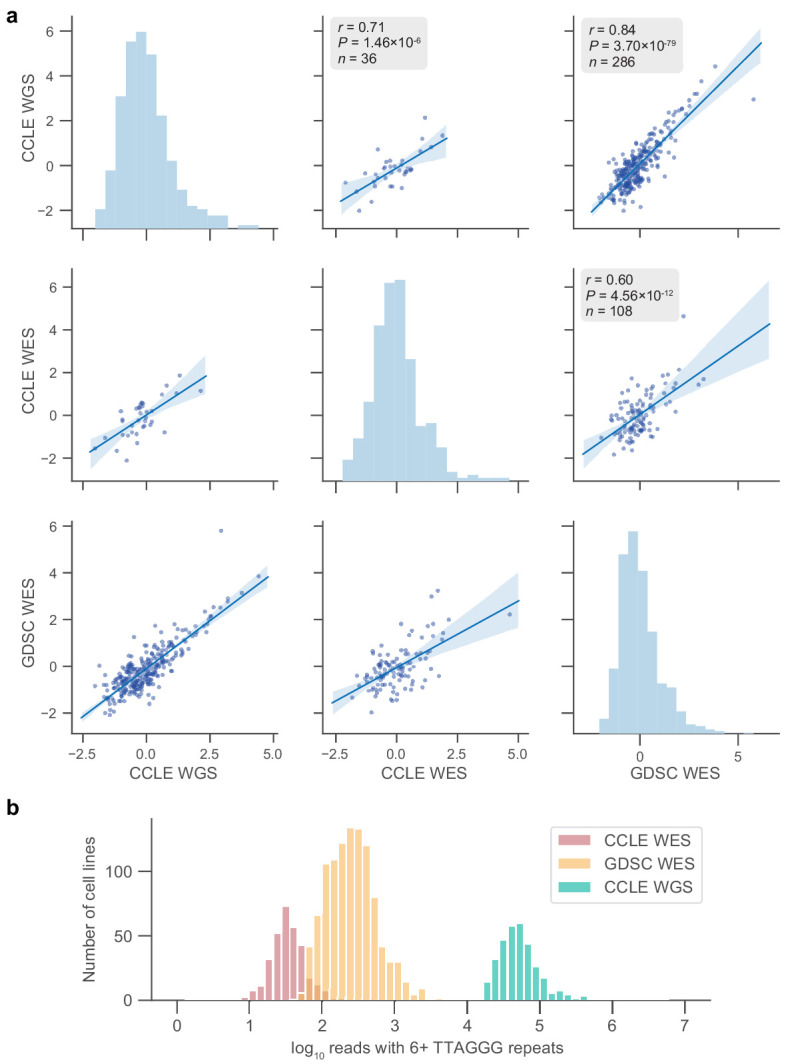
Figure 1—figure supplement 3. Telomere content, age, and tissue subtype.
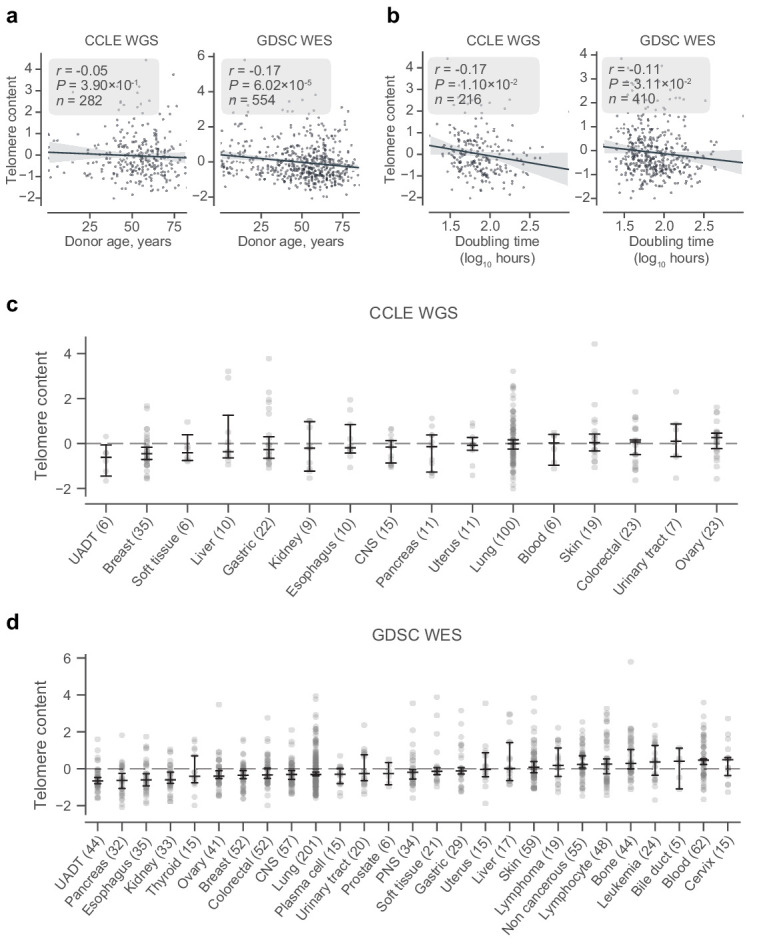
Figure 1—figure supplement 4. Transcriptomic associations between TERT, TERC, and telomere content.

Figure 1—figure supplement 5. Associations between telomere content and cell line characteristics.
