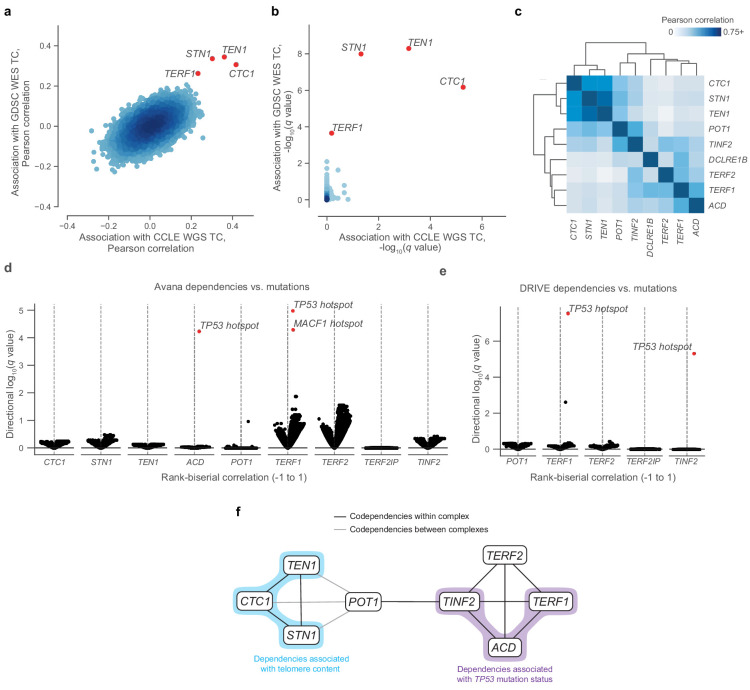
Figure 2. Telomere-binding protein dependencies are associated with telomere content and TP53 mutation status.
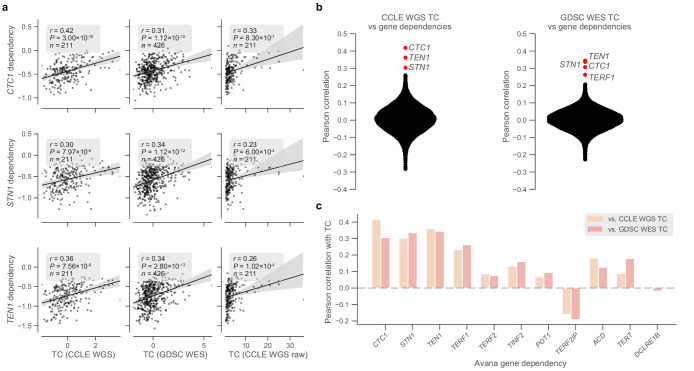
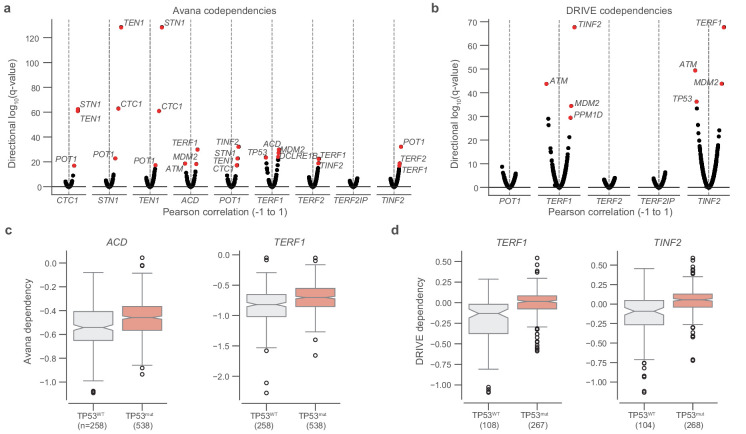
(a) Pairwise plot of Pearson correlations between dependencies of all genes in the Avana dataset and CCLE WGS telomere content (x-axis, n = 210–211 cell lines) and GDSC WES telomere content (y-axis, n = 420–426 cell lines) estimates. (b) Pairwise plot of significance levels of correlations shown in (a) with correction for multiple hypothesis testing. (c) Pairwise Pearson correlation matrix between Avana dependencies among CST members and five shelterin components (n = 796–808 cell lines; Supplementary file 3). (d) Associations of CST and shelterin member Avana dependency scores with damaging and hotspot mutations (n = 796–808 cell lines). For each gene dependency, mutation associations were computed using rank-biserial correlations with mutants and wild-types as the two categories. p Values determined using two-sided Mann-Whitney U test. (e) Associations of shelterin member DRIVE dependency scores with damaging and hotspot mutations (n = 372–375 cell lines; Supplementary file 3) under the same scheme used in (d). (f) Network schematic of the co-dependency matrix shown in (c) and annotated with association with telomere content or TP53 mutation status.


