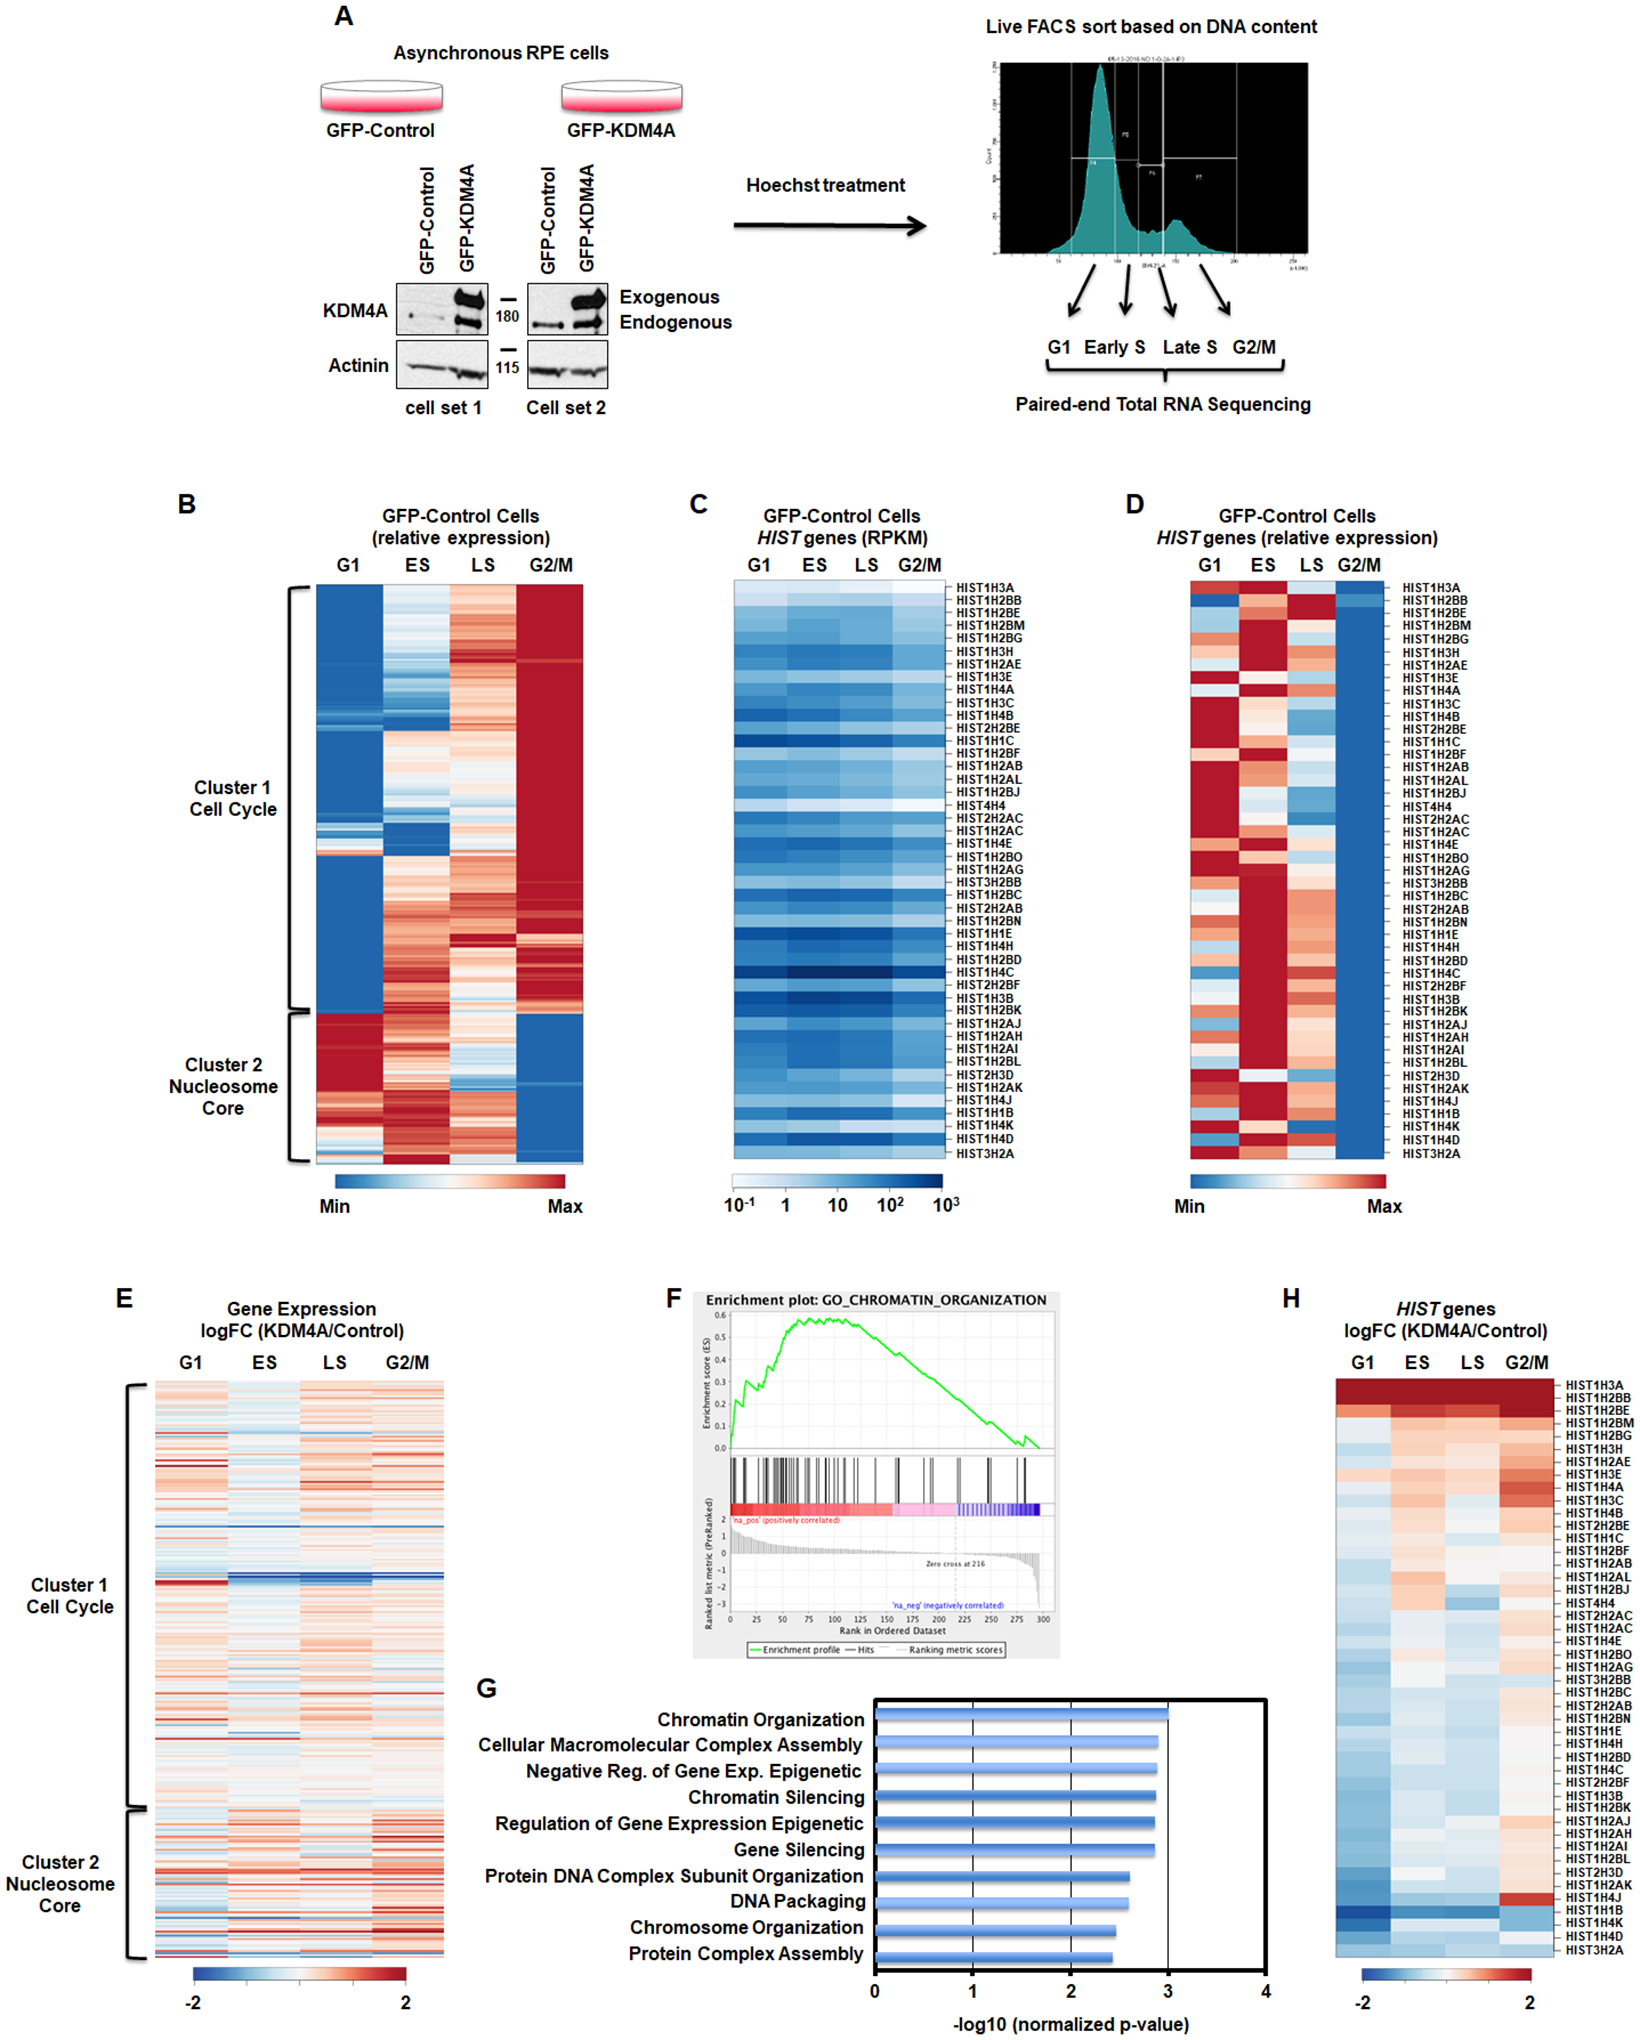
Figure 1.

KDM4A regulates gene expression over cell cycle. A. Description of the method. B. Differential gene expression patterns across cell cycle in control RPE cells. The heatmap represents the levels of expression at four phases of cell cycle for the genes that show more than two-fold change in expression between any two phases. Colors indicate relative expression values scaled between minimum and maximum levels for a given gene. Clusters of expression patterns are annotated by highly overrepresented gene categories (Cell Cycle: p-value = 4.5e-55; Nucleosome Core: p-value = 1.1e-32). C,D. Absolute gene expression values (RPKM) and relative expression values of replicative histone genes across cell cycle. E. Differential gene expression between KDM4A and control cells across cell cycle (log fold change). Gene order is the same as in B. All results represent the average over two biological replicates. F. The cell cycle regulated genes whose expression was changed upon KDM4A overexpression were enriched in chromatin organization related genes. GSEA enrichment plot for the GO category of Chromatin Organization. G. Enrichment p-value for top 10 functional categories detected by GSEA among the cell cycle regulated genes that were misregulated upon KDM4A overexpression. H. Differential expression of replicative histone genes between KDM4A and control cells (log fold change of RPKM). All results represent the average over two biological replicates.
