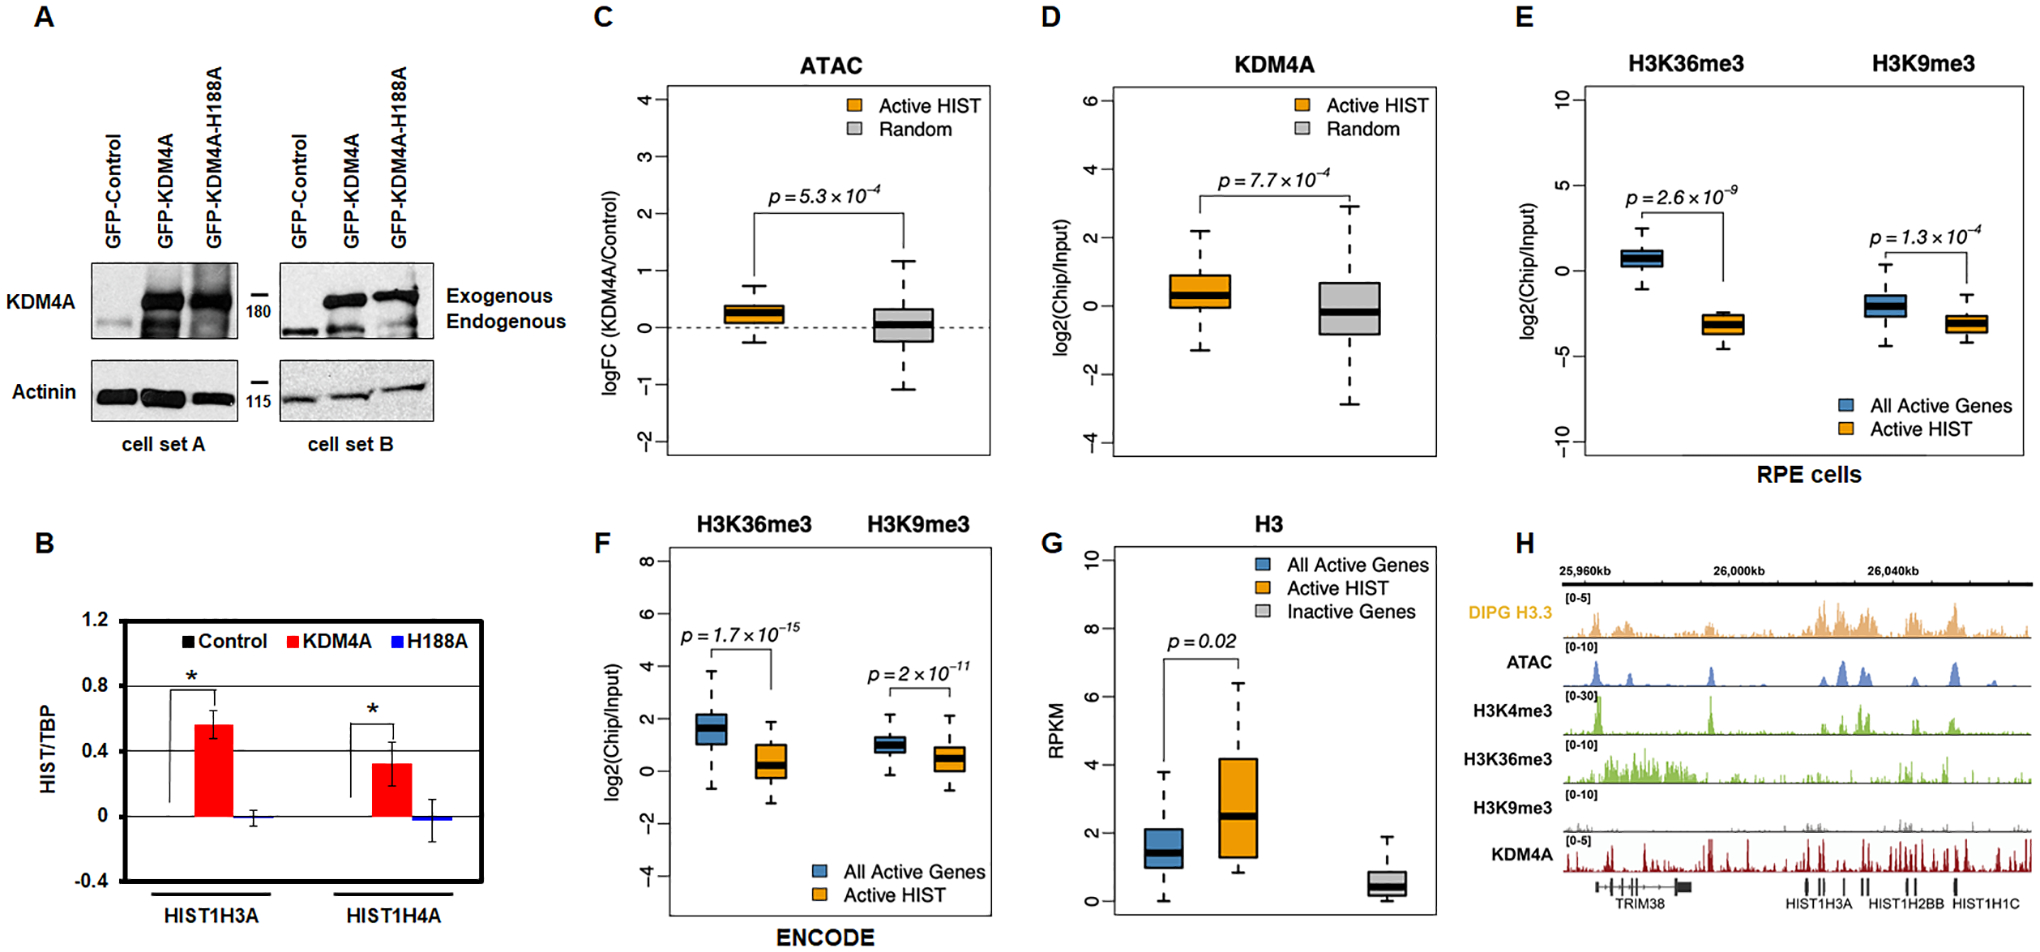
Figure 3.

KDM4A regulation of replicative histone genes requires its catalytic activity. A. Western blot representing two biologically independent cell lines used to assess KDM4A catalytic activity. B. Log2 ratios between expression values of specific histone genes and TBP, relative to control cells, for control (black), KDM4A (red), and KDM4A-H188A overexpressing cells (catalytic mutant, blue). Averages over two biological replicates are shown. C. Promoters of active replicative histone genes increase their accessibility upon KDM4A overexpression. Boxplots of the fold change in ATAC-seq read density upon KDM4A overexpression, compared to control, at TSS-proximal regions (TSS +/− 1Kbp) of active histone genes, compared to a random sample of other transcriptionally active genes. D. KDM4A presents an increased occupancy at the promoters of active replicative histone genes. Boxplots of the ChIP-seq enrichment of KDM4A (log ratio of ChIP over input) at TSS-proximal regions (TSS +/− 1Kbp) of active histone genes compared to a random sample of other transcriptionally active genes (defined based on RNA-seq expression values, RPKM>1). E. Unlike other transcriptionally active genes (defined based on RNA-seq expression values, RPKM>1), the bodies of histone genes are depleted in H3K36me3. They are also depleted in H3K9me3. ChIP-seq enrichment of H3K36me3 and H3K9me3 at histone genes and other transcriptionally active genes. F. H3K36me3 and H3K9me3 enrichment at all active genes and active replicative histone genes from ENCODE human GM12878 human cells. G. Similar to other transcriptionally active genes, histone genes are enriched in histone H3. ChIP-seq enrichment of histone H3.3 at histone genes and other transcriptionally active genes based on public ChIP-seq data from DIPG cells [31]. H. Open chromatin and enrichment of active promoter histone marks and histone H3 at histone genes. Genomic tracks show the peaks of ATAC-seq signal and ChIP-seq enrichment of active histone mark H3K4me3, but no strong enrichment of H3K36me3 or H3K9me3 marks. The ChIP-seq enrichment of histone H3.3 [public data from DIPG cells (DIPG H3 ChIP-seq; [31]) is shown as a separate track on top. The KDM4A ChIP-seq enrichment [24] is shown as a separate track on the bottom.
