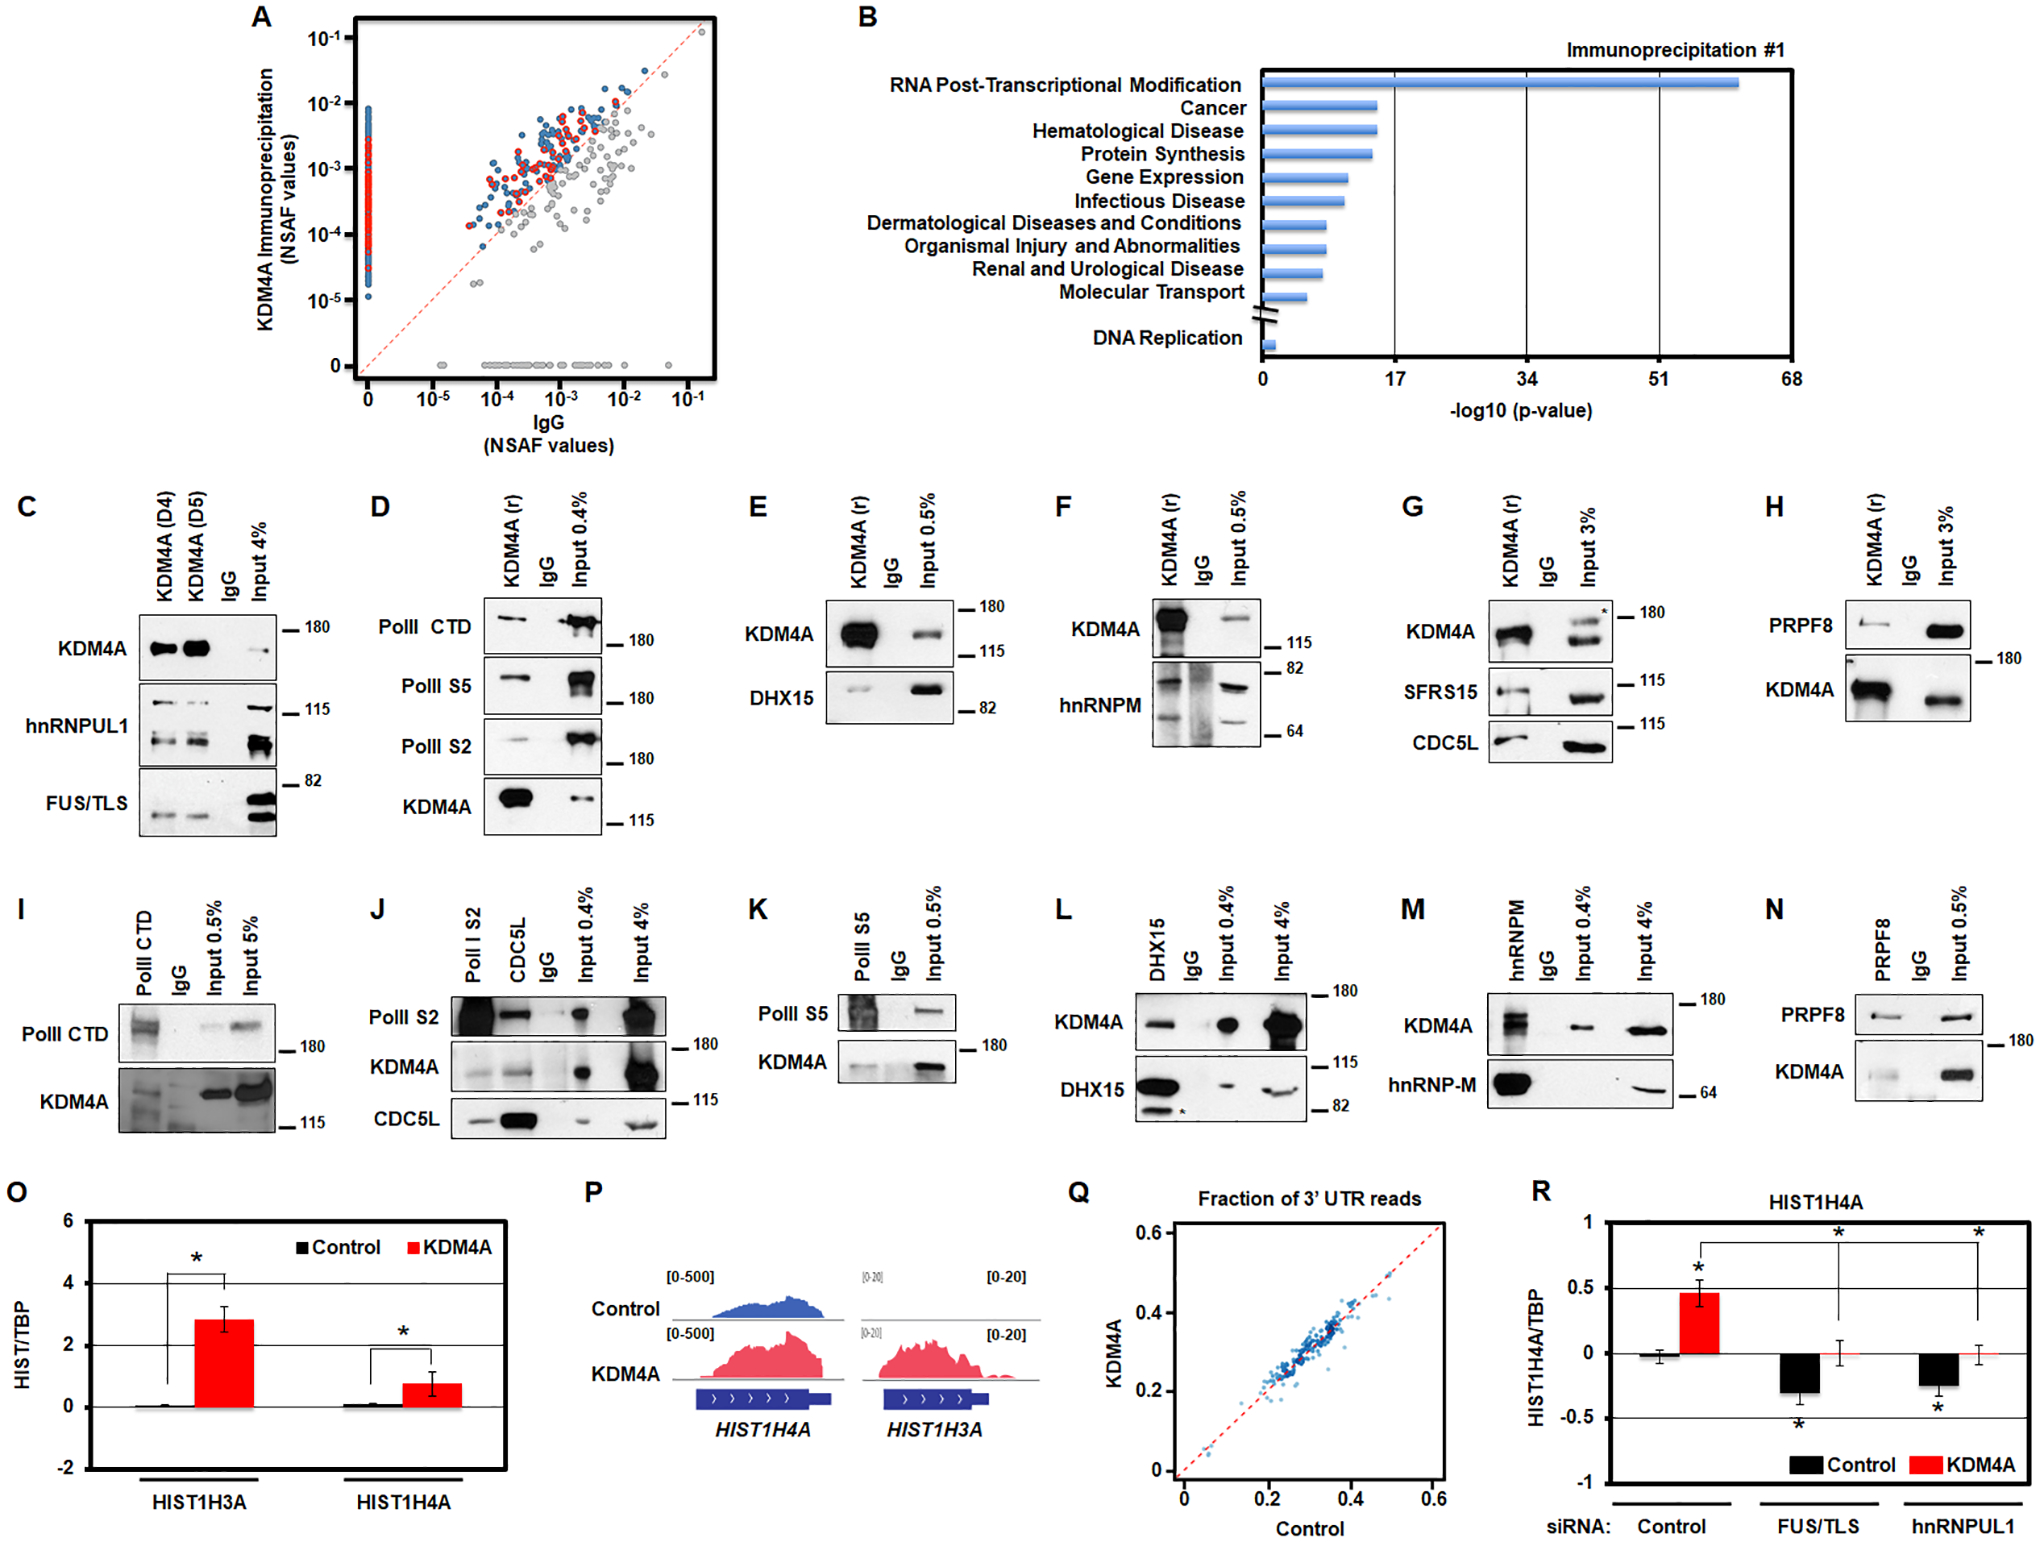
Figure 4.

KDM4A interacts with the transcription/processing machinery controlling replicative canonical histone gene expression. A. KDM4A interacting proteins are enriched in the functional category associated with RNA post-transcriptional modifications. Scatter plot of normalized spectral abundance factors (NSAF) from mass spectrometry experiments for immunoprecipitation (IP) with KDM4A (y axis) vs IgG as a control (x axis). Blue points, proteins with stronger presence in KDM4A IP. Red points, proteins from “RNA Post-Transcriptional Modification” category according to Ingenuity Pathway Analysis (IPA). B. Enrichment p-values for functional categories detected by Ingenuity Pathway Analysis (IPA) among protein sets from mass spectrometry analyses of endogenous KDM4A complexes. In addition to top 10 categories represented, p-value for DNA replication category studied in [12] is shown. C. Endogenous KDM4A was immunoprecipitated from 293T cells with two antibodies (D4 and D5) followed by an immunoblot against hnRNPUL1 and FUS/TLS. 4% of input material was loaded. D. Endogenous KDM4A was immunoprecipitated from 293T cells followed by an immunoblot against Polymerase II (PolII CTD), Polymerase II phosphorylated on Serine 5 (PolII S5) and Serine 2 (PolII S2). 0.4% of input material was loaded. E. Endogenous KDM4A was immunoprecipitated from 293T cells followed by an immunoblot against DHX15. 0.5% of input material was loaded. F. Endogenous KDM4A was immunoprecipitated from 293T cells followed by an immunoblot against hnRNP-M. 0.5% of input material was loaded. G. Endogenous KDM4A was immunoprecipitated from 293T cells followed by an immunoblot against SFRS15 and CDC5L. 3% of input material was loaded. * indicates non-specific band on western. H. Endogenous KDM4A was immunoprecipitated from 293T cells followed by an immunoblot against PRPF8. 3% of input material was loaded. I-N. Endogenous members of the transcription/splicing machinery were immunoprecipitated from 293T cells followed by an immunoblot against KDM4A and other annotated proteins. * indicates non-specific band on western (L). O. Log2 ratios between the amount of RNAs from chromatin fraction for specific histone transcripts and TBP, relative to control cells, for control (black) and KDM4A overexpressing cells (red). Averages of five replicates for two biologically independent cells lines are shown. P. Examples of RNA sequencing tracks at replicative histone genes in control and KDM4A overexpressing cells. Q. Scatter plot of RNA sequencing coverage at 3’ UTR as a fraction of the coverage over the entire gene for all replicative histone genes in KDM4A overexpressing cells versus control cells. Averages of two biologically independent cell lines are shown. * T-test p-value < 0.05 relative to control cells. R. Log2 ratios between expression values of HIST1H4A and TBP, relative to control cells siRNA control, for control (black) and KDM4A overexpressing cells (red). The results represent the average of three replicates for two biologically independent cell lines transfected with two independent siRNAs. * T-test p-value < 0.05 relative to control cells or to control cells siRNA control, or between the two samples indicated with brackets when * is above a bracket.
