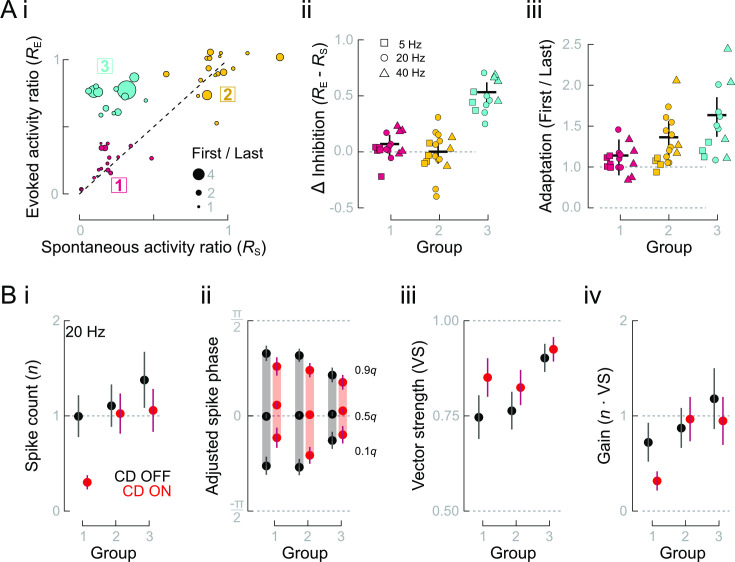
Fig 6. Heterogeneous adaptation rates and CD strengths result in distinct afferent neuron response types.
(A) (i) The ratios (CD ON/CD OFF) of evoked and spontaneous activities (RE and RS) revealed 3 distinct clusters of response types. (ii) RE and RS were equal in groups 1 and 2 (Δ Inhibition = 0) but diverged in group 3. (iii) The extent of adaptation increased from group 1 to group 3, shown as First/Last responses to highlight the range of adaptation. (B) Evoked activities and responses to CD differ among response types at 20 Hz. (i) Only groups 1 and 3 exhibited significant CD inhibition, as followed from the cluster analysis. (ii) Group 1 and 2 responses had wider response intervals than group 3, but all groups’ response intervals were narrowed by CD. Additionally, CD ON resulted in a delayed median phase of groups 1 and 3, compared with the median phase of CD OFF. (iii) The larger response interval widths of groups 1 and 2 resulted in lower vector strength that was more impacted by CD, compared with group 3. (iv) Gain was substantially reduced in group 1 responses reduced and constant or slightly increased in groups 2 and 3, although still approximately unity. Data and code underlying this figure and details of statistics and group comparisons may be found at DOI: 10.6084/m9.figshare.13034012. CD, corollary discharge; VS, vector strength.

