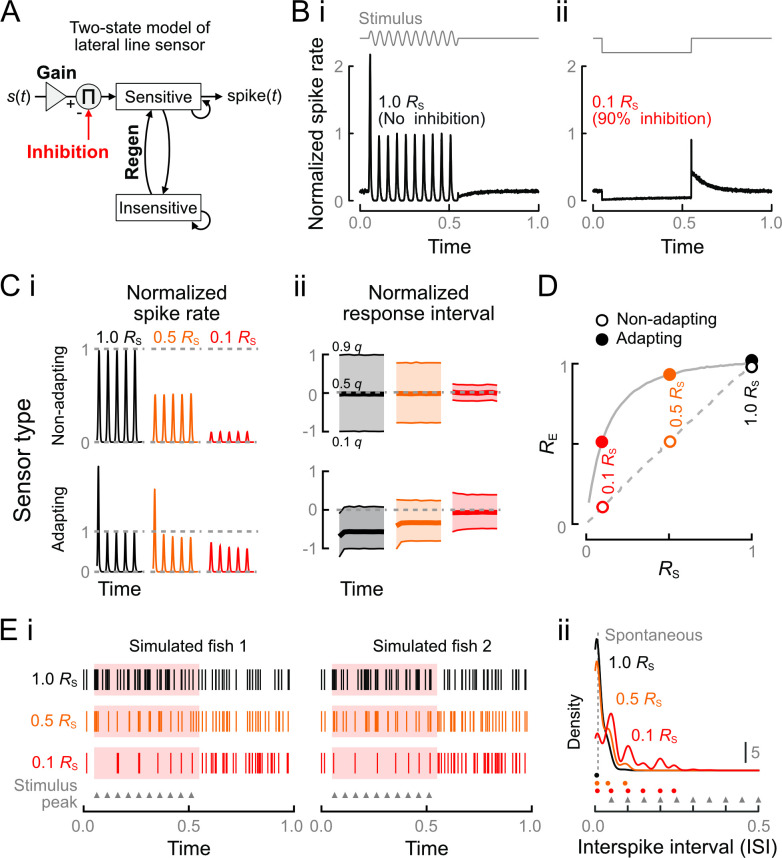
Fig 7. Computational model of the effects of heterogeneity on lateral line sensing.
(A) (i) Schematic of the 2-state model of lateral line feedback. The input stimulus is transduced by a sensor with variable gain and regeneration rates. The simulated sensor responds probabilistically to the stimulus only while in its sensitive state, after which it transitions to and remains in the insensitive state until regeneration. Tuning of the gain and regeneration constants was used to model adapting and nonadapting response types when subject to inhibition of strength RS. (B) Simulated responses of an adapting sensor to stimulation with no inhibition (i) or to strong inhibition in the absence of stimulation (ii). Our model recapitulated the observed changes in spike rate in each condition. After stimulation, the sensor exhibited a refractory period before recovering spontaneous spike rates, whereas after suppression it exhibited rebound spiking. (C) Adaptation rates determine the dependence of spike count (i) and phase interval (ii) on inhibition. Nonadapting responses were constant over time and both spike count and response intervals were reduced proportionately to RS. Responses of adapting sensors were nonlinear over time and with respect to inhibition strength, although the nonlinearities were largely suppressed by the strongest level of inhibition (0.9 RS). Spike counts and phases were normalized to the steady states with 1.0 RS. (D) Nonadapting responses maintained RE = RS for all RS, whereas RE > RS for all RS < 1 in adapting responses, supporting the observed response clusters in Fig 6. Dashed and solid gray lines denote the trajectories of nonadapting and adapting responses at inhibition strength intervals of 0.02. Values at RS = 1 are staggered for visibility. (E) Simulated feedback from a population of heterogeneous sensors. (i) In the absence of inhibition (1.0 RS), stimulus phase was difficult to discriminate. Strong inhibition (0.1 RS) resulted in regular feedback closely corresponding to the stimulus peaks (triangles). (ii) The stimulus frequency was poorly reflected in the ISIs at 1.0 RS, but at 0.1 RS, we observed prominent peaks corresponding to integer multiples of the stimulus frequency. The ISIs corresponding to density peaks at each RS are denoted by circles. Vertical dashed line is the ISI of spontaneous spiking activity. The data and code underlying this figure may be found at DOI: 10.6084/m9.figshare.13034012. ISI, interspike interval.

