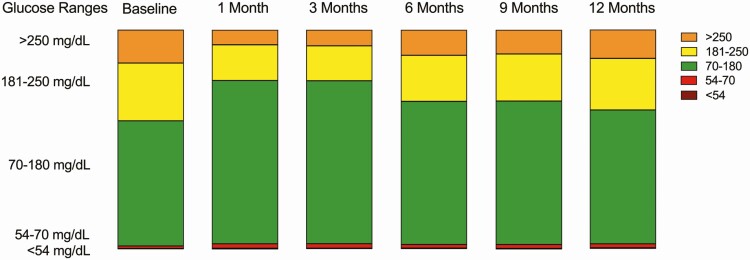
Figure 2.
Stacked bar graphs representing continuous glucose monitoring glucose ranges for all participants: percentage of time in hyperglycemia (181-250 mg/dL and > 250 mg/dL), percentage of time in range (70-180 mg/dL), and percentage of time in hypoglycemia (54-70 mg/dL and < 54 mg/dL). All data reported as mean ± SD.

