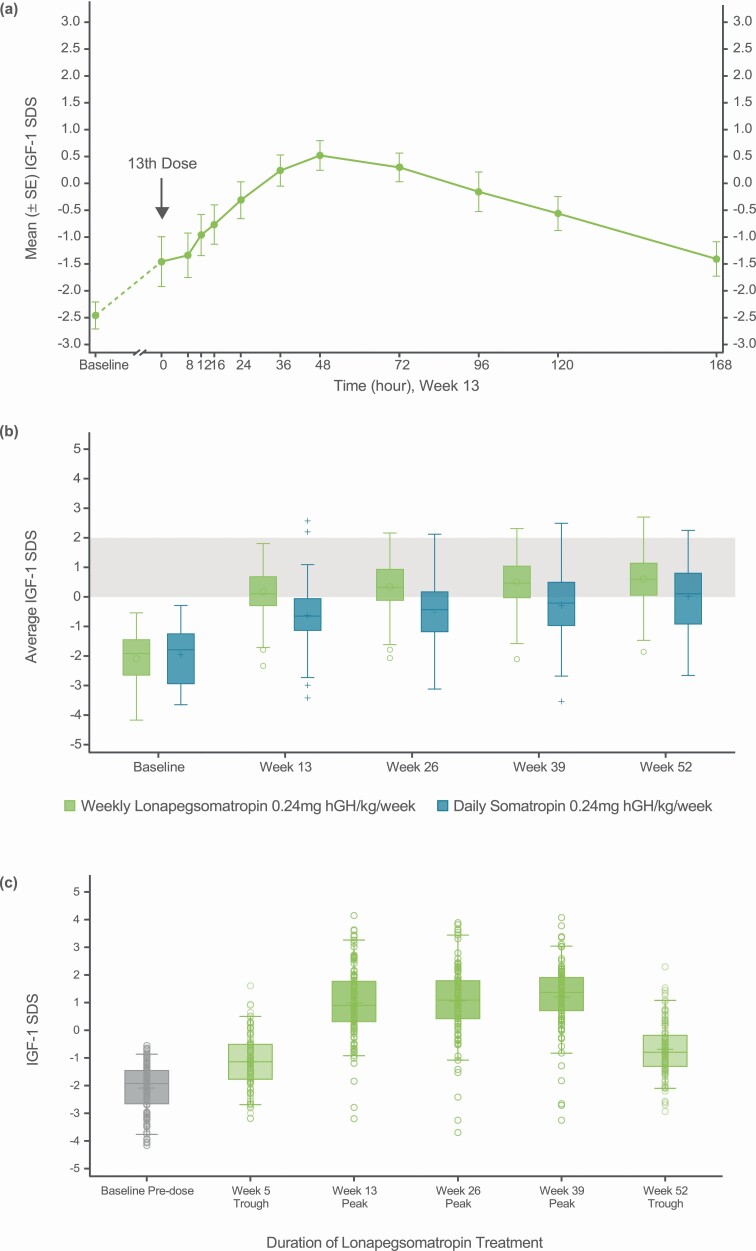
Figure 5.
(A) Insulin-like growth factor 1 (IGF-1) weekly profile following lonapegsomatropin administration. (B) Average IGF-1 SD score (SDS) over 52 weeks of treatment. (C) Observed IGF-1 SDS at baseline, peaks, and troughs for the lonapegsomatropin group. (A) shows the IGF-1 profile from a lonapegsomatropin population subset (n = 11) over 7 days following the 13th dose, with a steady state SDS difference between peak and trough of approximately 2. The box-and-whisker plots in (B) show the derived average (lonapegsomatropin) and observed (daily somatropin) IGF-1 SDS over 52 weeks in the intention-to-treat population. For the daily somatropin group, average IGF-1 SDS were represented by observed values given the relative stability of IGF-1 levels with daily somatropin. At all visits, the lonapegsomatropin group had a higher average IGF-1 SDS, thus reaching a range of IGF-1 SDS 0-2 (shaded grey area) sooner than did the daily somatropin group. For each box-and-whisker plot, the upper and lower box edges represent the 75th and 25th percentiles. Within the box, the horizontal bar indicates the median, while the circle (for lonapegsomatropin) or plus sign (for daily somatropin) corresponds to the mean. The upper and lower ends of the whiskers represent the highest and lowest observed values within 1.5 times the interquartile range above and below the 75th and 25th percentiles, respectively. Outside the box, open circles (lonapegsomatropin) and plus signs (daily somatropin) correspond to observed values beyond 1.5 times the interquartile range above and below the 75th and 25th percentiles. Similarly, the box-and-whisker plots for observed IGF-1 levels for lonapegsomatropin-treated subjects at baseline, troughs (weeks 5 and 52), and peaks (weeks 13, 26, and 39) are presented in (C). The circles represent individual subject levels.

