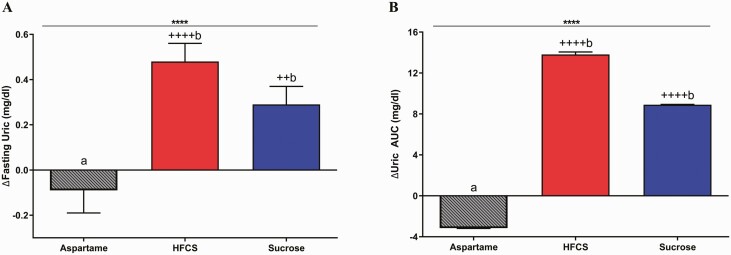
Figure 8.
Change in circulating uric acid concentrations: the mean ± SEM of the absolute change (intervention—baseline) of fasting uric acid (7A) and 24-hour uric acid AUC (7B) in subjects consuming aspartame- (n = 23), HFCS- (n = 28), or sucrose-sweetened beverages (n = 24) for 2 weeks. ****P < 0.0001, effect of SB group, 2-factor (SB group, sex) ANCOVA with adjustment for outcome at baseline, BMI and SB group × sex. ++P < 0.01, ++++P < 0.0001, LS mean different from 0; a different from b, Tukey’s.

