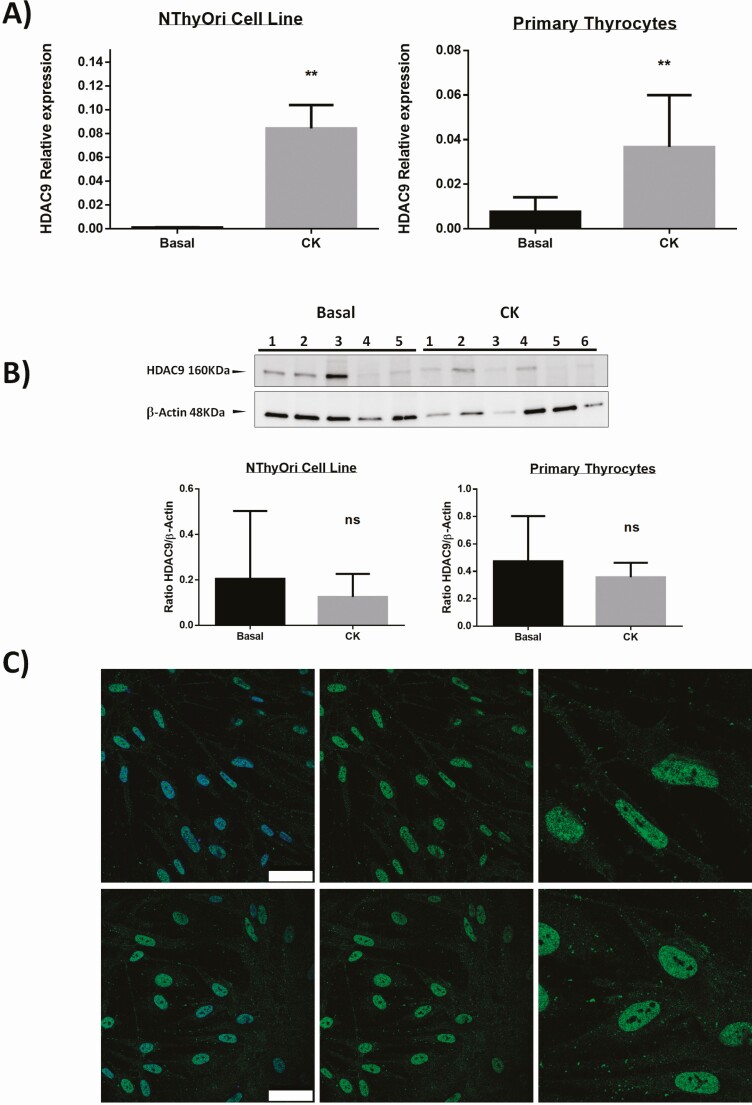
Figure 2.
HDAC gene expression in thyroid cell cultures. A) Primary thyrocytes and NThyOri cell were cultured in the presence or not of IFN-γ and TNF-α (CK), and then the levels of HDAC9 mRNA were analyzed by RT-qPCR. A significant induction of HDAC9 gene is shown in both cell types. B) Primary thyrocytes and NThyOri cell were cultured in the presence or not of IFN-γ and TNF-α (CK), and then the levels of HDAC9 were analyzed by Western blot. No significant differences in the levels of HDAC9 synthesis induction was detected. C) Immunofluorescence microscopy analysis of HDAC9 expression (green fluorescence) in primary thyroid cell cultures, in the presence or not of IFN-γ and TNF-α (CK). Cell nuclei were stained with DAPI (blue fluorescence). Scale bar = 50µm. Data correspond to the arithmetic mean ± SD. Abbreviations: ns, not significant. *P < 0.05; **P < 0.01; ***P < 0.005.

