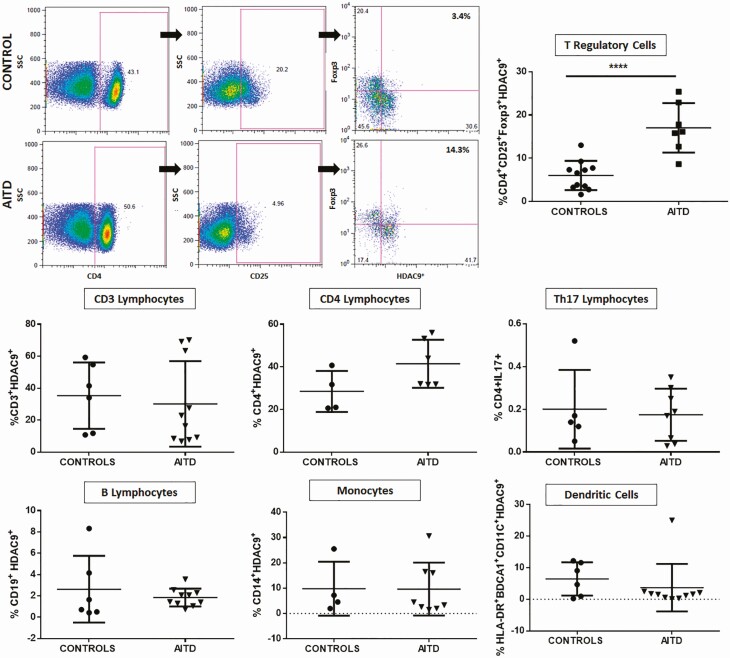
Figure 5.
Flow cytometry analysis of HDAC9 expression by different cell subsets from patients with AITD. Peripheral blood mononuclear cells from patients with AITD and healthy controls were immunostained for CD3+ (T lymphocytes), CD4+CD25+ Foxp3+ (T regulatory cells), CD19+ (B lymphocytes), CD14+ (monocytes) and HLA-DR+CD11c+ BDCA1+ (myeloid dendritic cells), and HDAC9, and the cells were analyzed by flow cytometry, as stated in “Methods.” Analysis strategy is shown in the dot plot left panel. A significant increase in the percent of HDAC9+ Treg (CD4+CD25+Foxp3+) cells was detected in patients with AITD compared with healthy controls. (right panel). *P < 0.05; ****P < 0.001.

