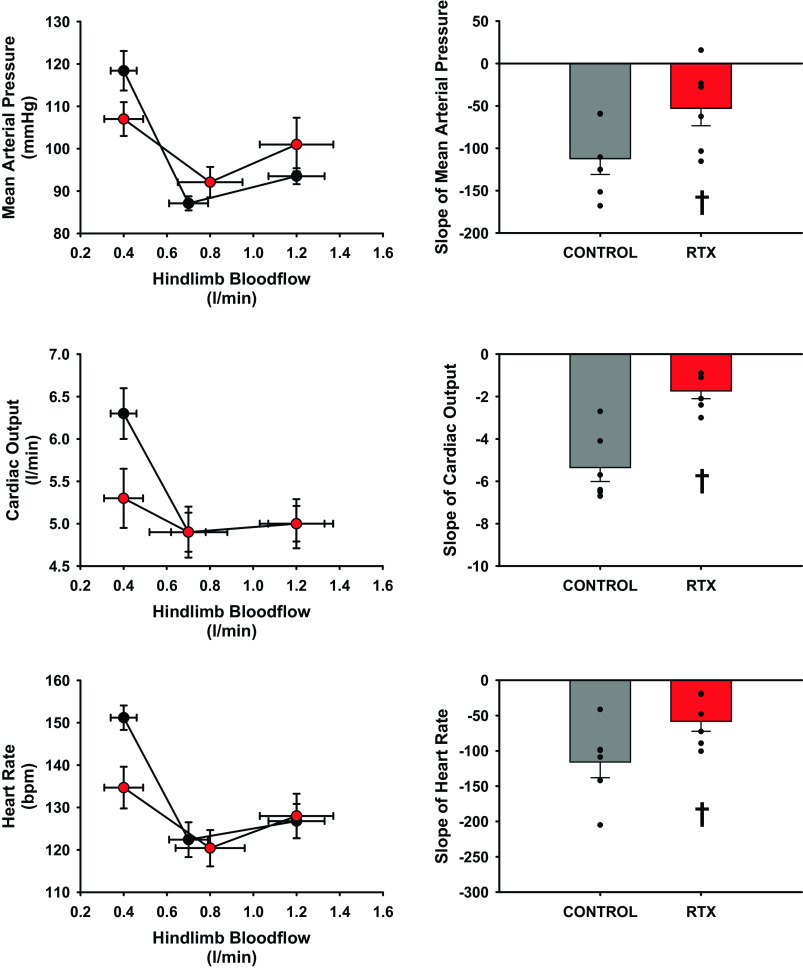
Figure 4.
Assessment of changes in the gain of the muscle metaboreflex determined by the slope of the linear regression taken from 1-min averaged steady states at each successive reduction in hindlimb blood flow from threshold to peak reflex activation before (black circles, gray bars) and after administration of RTX (red circles, red bars). Line graphs should be observed from the right point (exercise) to the middle point (reflex threshold) to the final point left (peak muscle metaboreflex activation) as hindlimb blood flow is reduced. Standard error shown on bar graphs with actual data points overlain. †Statistical significance between control (gray) and after administration of intrathecal RTX (2 µg/kg) (L4–L6) (red) (P < 0.05, Student’s paired t test), n = 6 animals. RTX, resiniferatoxin.

