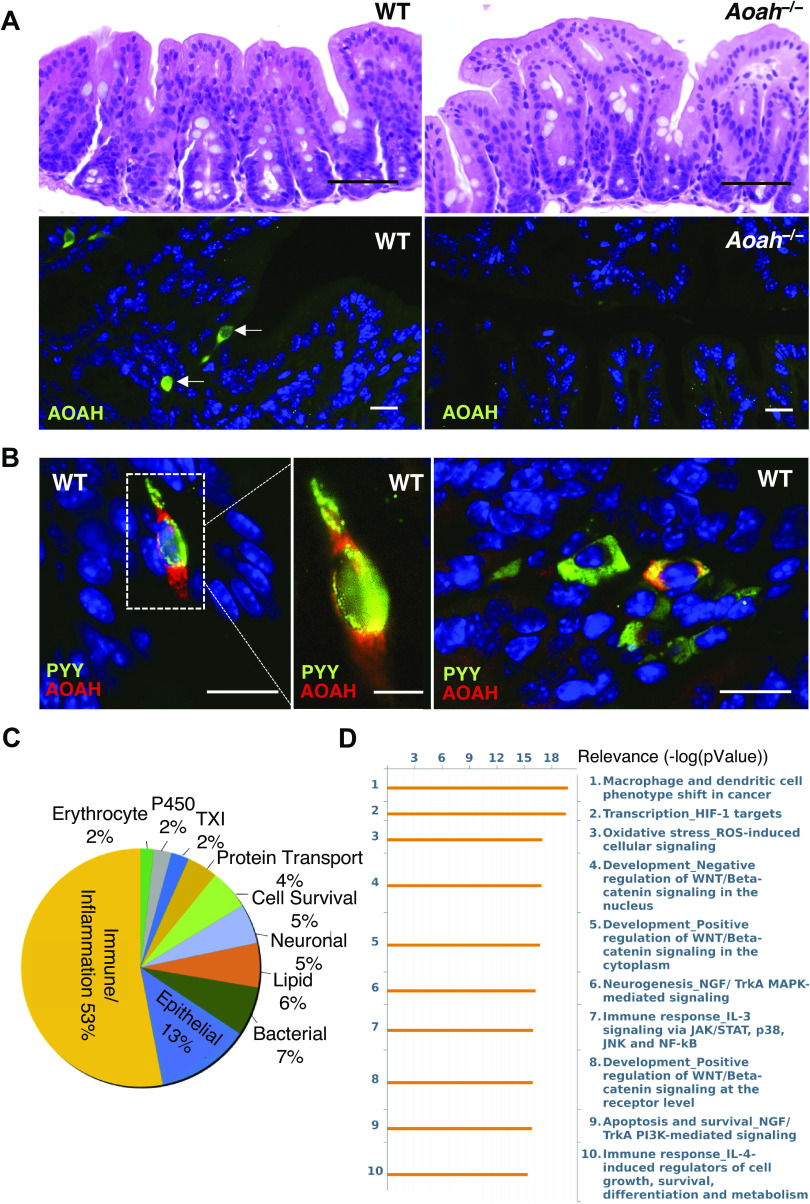
Figure 2.
AOAH-deficient mice have normal gut morphology but altered gut signaling pathways. A: comparison of representative cecum H&E staining of female WT (top left) and Aoah−/− (top right) mice (n = 3 mice for both conditions, scale bar: 50 μm). Immunostaining of AOAH (green) in WT (bottom left) and Aoah−/− (bottom right) cecum. DAPI staining nuclei shown in blue (n = 3 mice for both conditions, scale bar: 17 μm). B: immunostaining of AOAH (red) and PYY (green) in WT cecum. DAPI staining nuclei shown in blue (n = 3 mice, scale bar: 17 μm for left and right, 7 μm for middle). C: pie chart of transcriptome profiling by microarray analysis showing levels of mRNA with 2-fold difference in AOAH-deficient cecum compared with wild-type (n = 5 mice for both conditions). D: pathway analysis indicating top 10 signaling pathways altered in AOAH-deficient cecum compared with wild-type (n = 5 mice for both conditions). AOAH, acyloxyacyl hydrolase; H&E, hematoxylin and eosin; HIF-1, hypoxia-inducible factor 1; WT, wild type.

