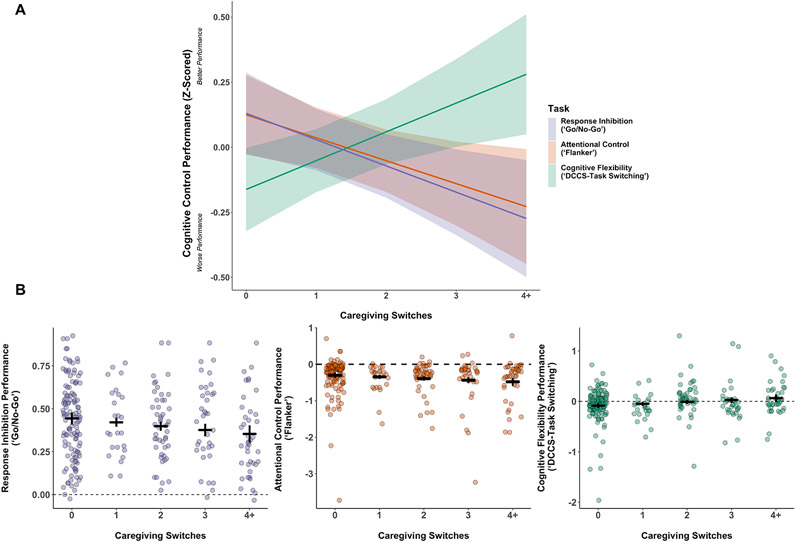
Figure 1A and 1B:
A. Fitted linear regression lines for z-scored response inhibition, attentional control, and cognitive flexibility performance at mean age and sex. Ribbons represent 95% confidence intervals. The y-axis represents z-scored performance metrics of hit – false alarm score for the Go/No-Go task, mean congruent trial RT – mean incongruent RT for the Flanker task, and mean repeat trial RT – mean switch trial RT for the DCCS task. The x-axis represents the number of caregiving switches, with all values greater than 4 represented in the 4+ bin. B. Raw individual data points of the association between caregiving switches and three measures of cognitive control performance. (left panel) The y-axis represents the proportion of hit trials - the proportion of false alarm trials on the Go/No-Go task. The dashed line represents a score in which the proportion of hits and the proportion of false alarms is equal. (middle panel) The y-axis represents the difference in mean RT between congruent and incongruent trials on the Flanker behavioral task. The dashed line represents when the mean RT for congruent trials is equal to that of incongruent trials. (right panel) The y-axis represents the difference in mean RT between repeat and switch trials on the DCCS task-switching behavioral task. The dashed line represents when the mean RT for repeat trials is equal to that of switch trials. The x-axes represent the number of caregiving switches, with all values greater than 4 represented in the 4+ bin. Black horizontal crossbars represent linear model fitted means for each task and black vertical bars represent 95% confidence intervals.

