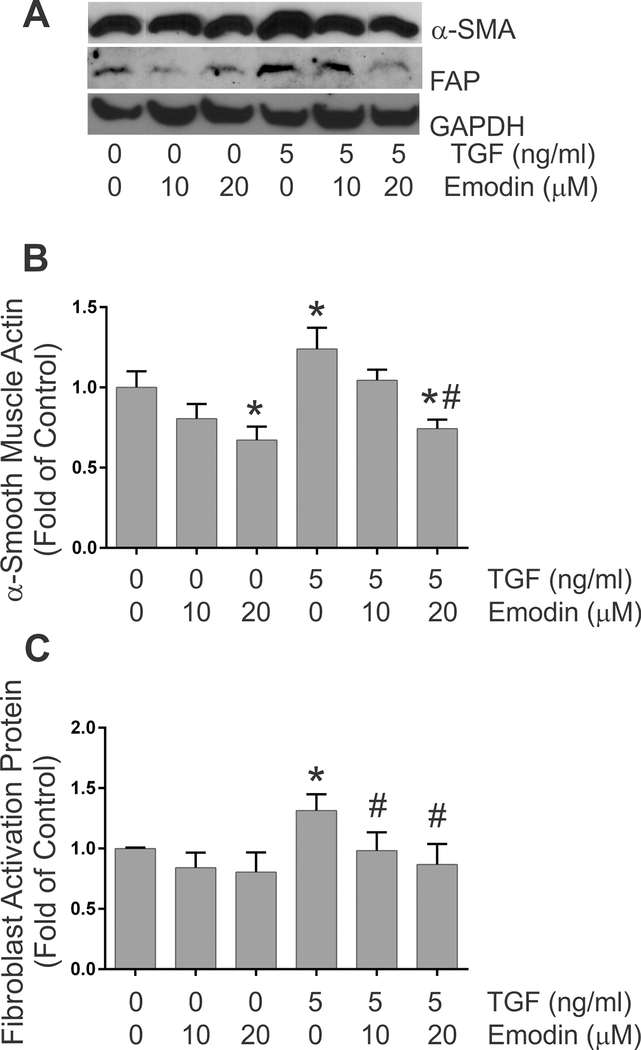
Fig. 4.
This figure illustrates the quantitative effects of TGF-β1 and emodin on the expression of α-smooth muscle actin (Figure 4B) and fibroblast activation protein (Figure 4C) levels as determined by immunoblots of cellular lysates. Data are presented as fold of the untreated controls. (* p <0.05 relative to untreated controls, # p <0.05 relative to TGF-β1 treatment alone as determined by ANOVA, n = 4). Images of representative immnoblots are shown in Figure 4A (α-SMA is α-smooth muscle actin, FAP is fibroblast activation protein and GAPDH is glyceraldehyde phosphate dehydrogenase).

