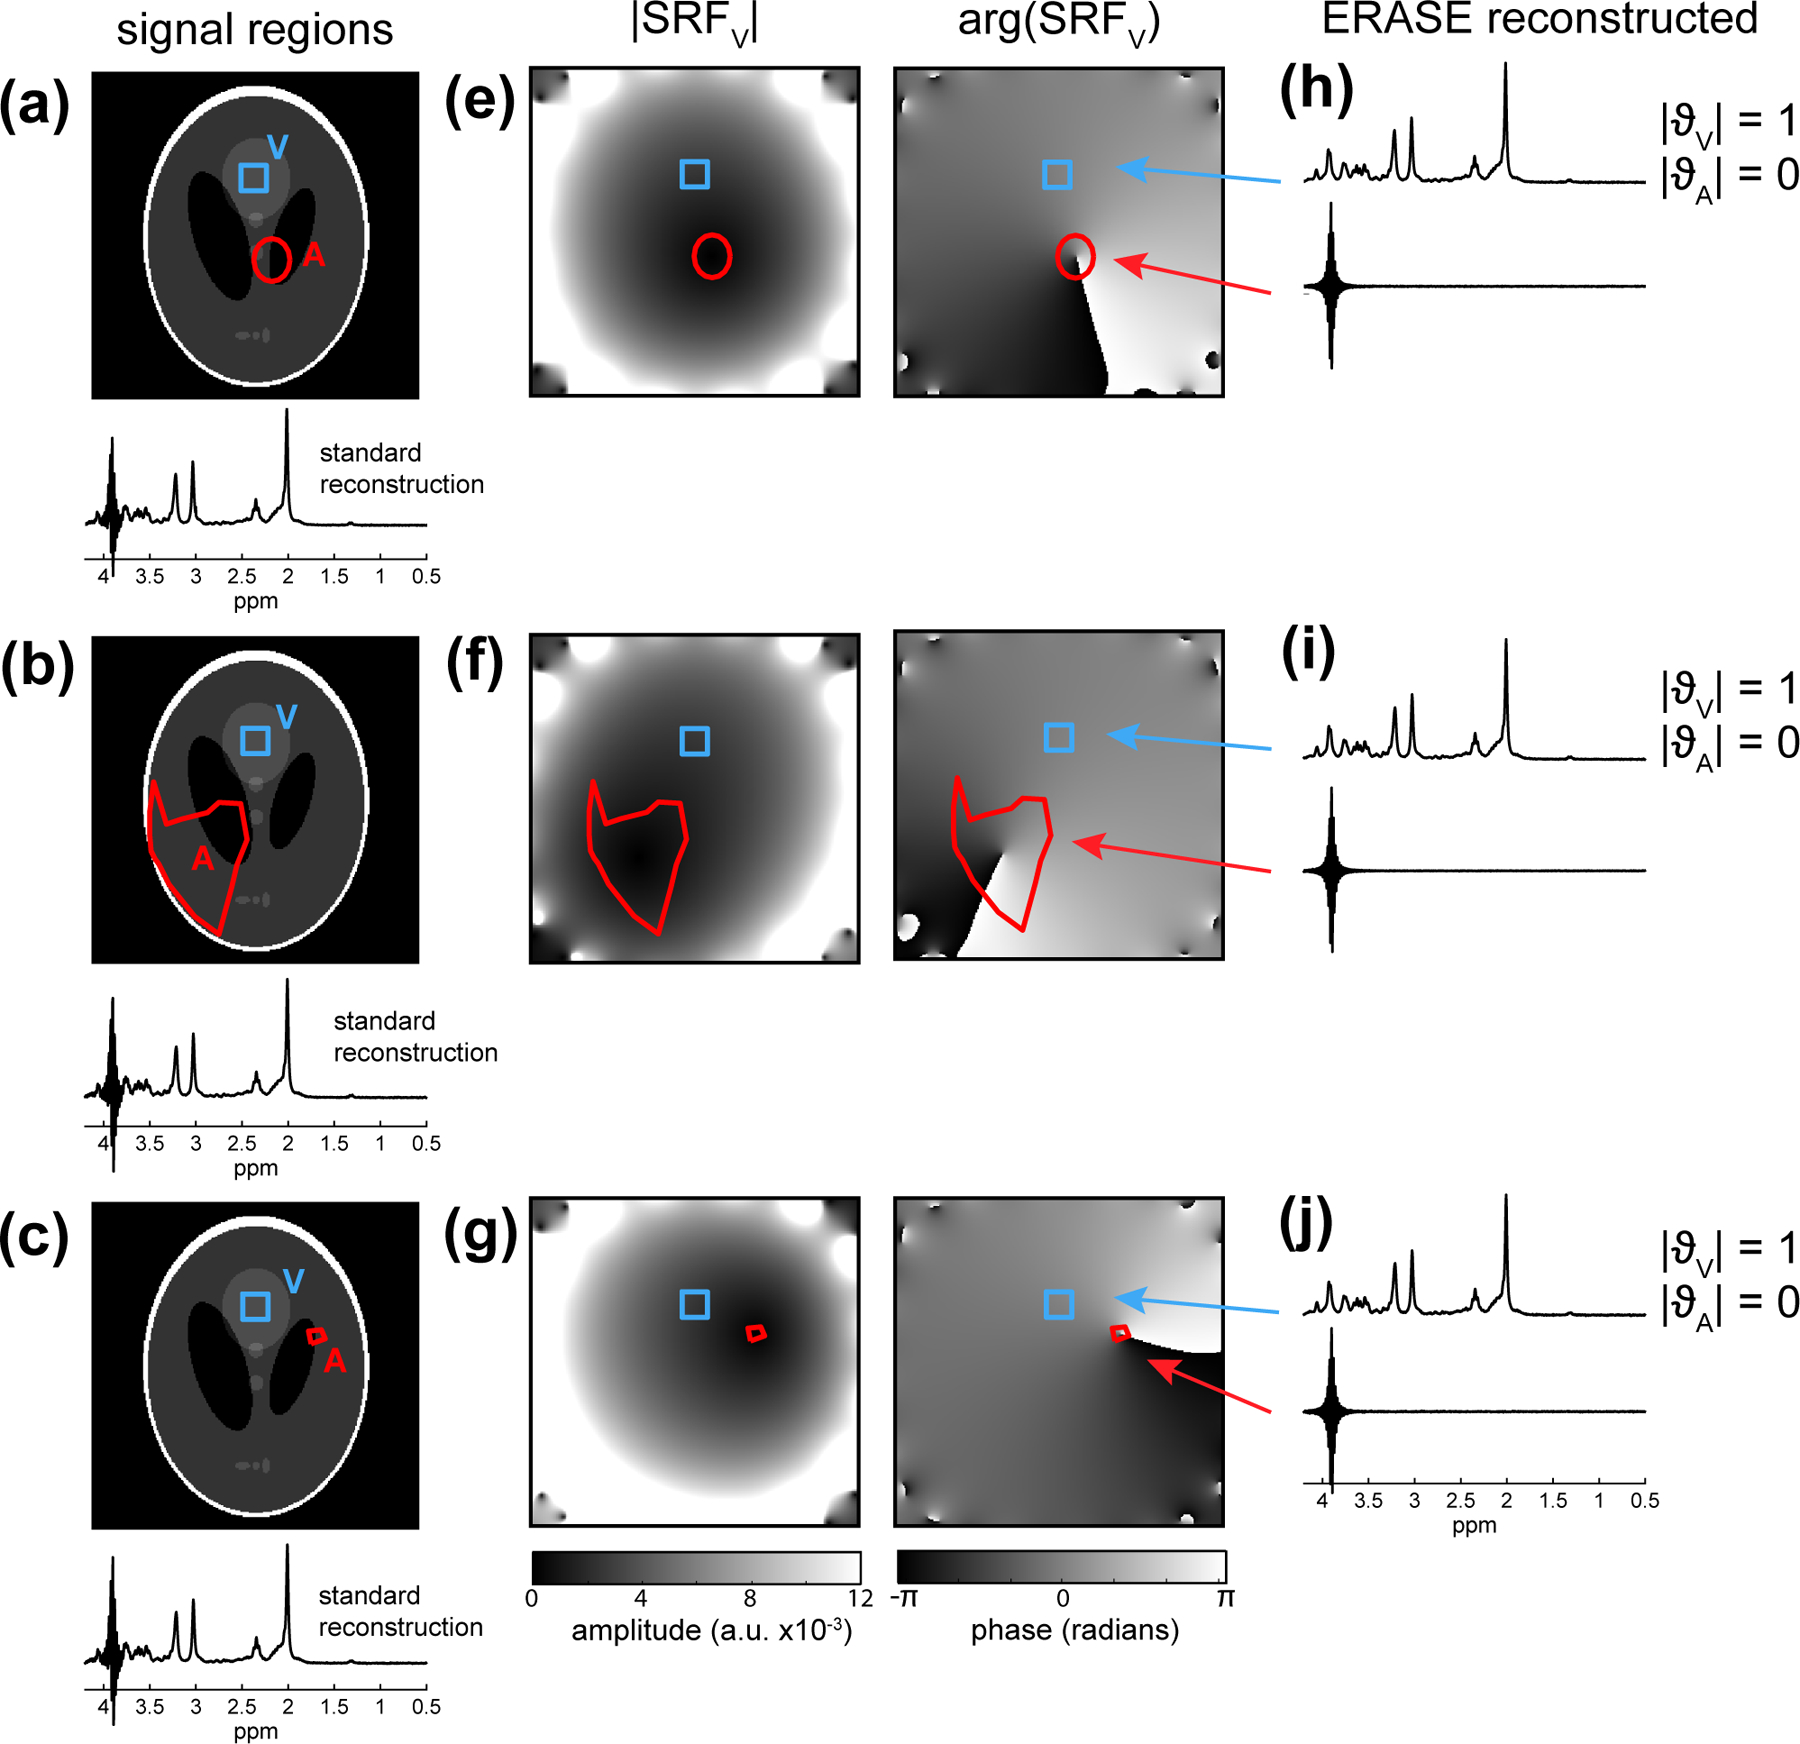
Fig. 1:

Numerical phantom simulations of the proposed artifact removal method for different sizes and locations of artifact regions (Experiment 1). A metabolite spectrum (STEAM, TE=14ms) was simulated to arise from an MRS region (V; blue) and a spurious echo artifact (at 3.9 ppm) from region (A; red). In (a-c), the artifact support region is varied and the coil-combined data using standard reconstruction is shown. Images (e-f) show the corresponding complex valued spatial response function () (Eq. 6) resulting from ERASE reconstruction and spectra (h-j) show the corresponding unfolded spectra using ERASE reconstruction. In all cases, there was complete removal of artifact from the metabolite spectrum as indicated by the integral of the over A, .
