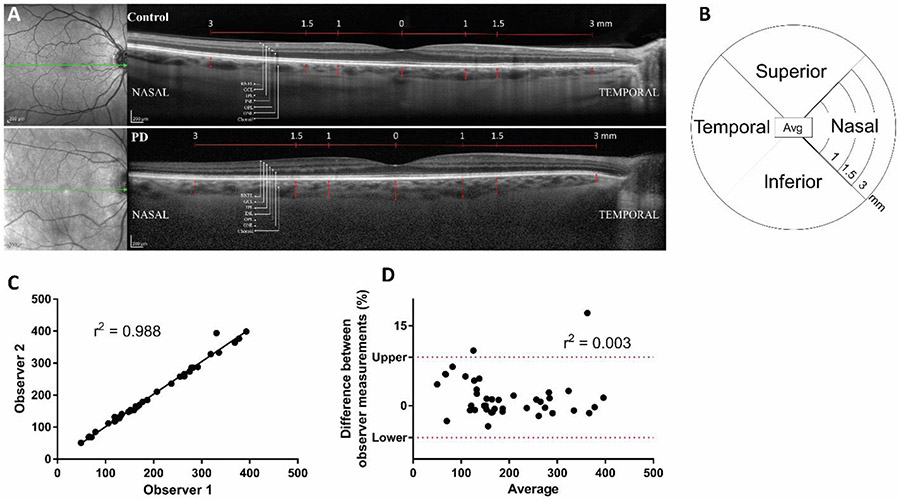
Fig 2. Methods and validation of OCT measurements.
A) Representative images of one PD participant OCT and one control participant OCT showing the nerve layers measured. The red arrows indicate the choroidal thickness. B) A representative plot of the 12 subregions measured [4 quadrants (superior, nasal, inferior, and temporal) at 3 distances (1, 1.5, and 3mm)] with the average value in the middle. Interobserver variability was determined by plotting C) observer 1 versus 2 measurements on a linear scatter plot where r2=0.988, indicating a very strong agreement between observer measurements; or D) the difference between observer measurements (%) versus the average measurement on a Bland-Altman plot where r2=0.003, indicating there is little difference between observer measurements.

