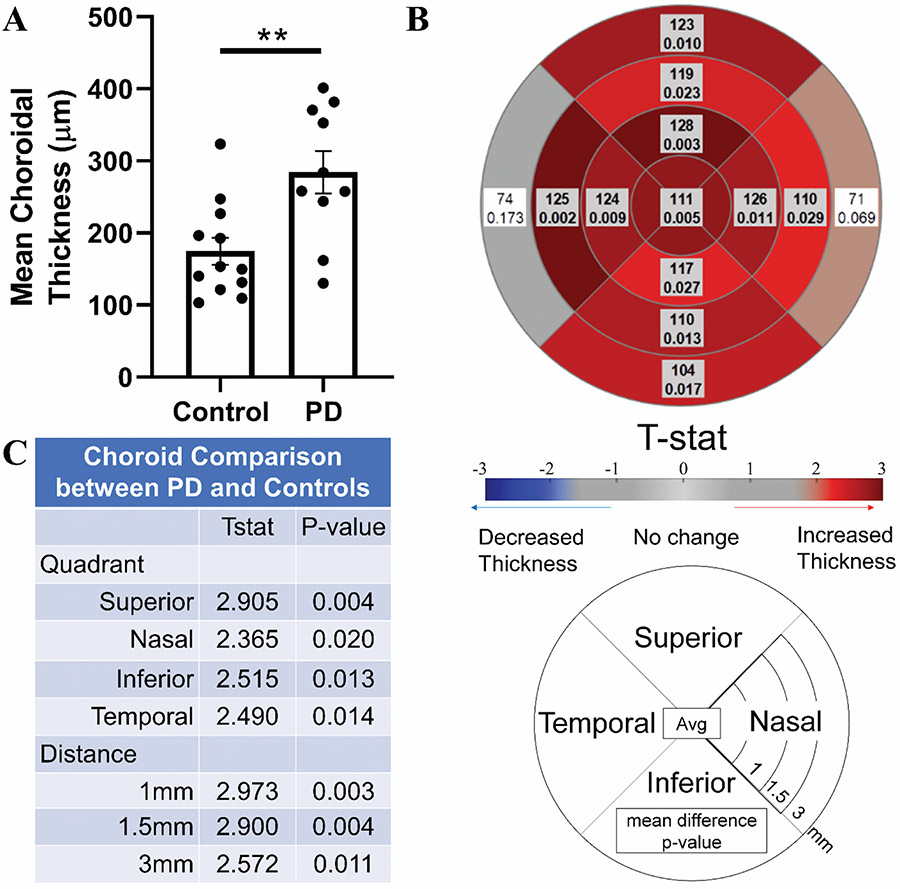
Fig 3. Comparison of choroidal thickness between PD and control participants.
A) Comparison of mean choroidal thickness between control and PD participants, correcting for age, sex, axial length, distance from fovea, and quadrant. B) Subregion analysis comparing control and PD participants using a mixed effect model correcting for age, sex, and axial length. Shaded/Bolded boxes represent significance (p<0.05). C) Effect of PD status on choroid thickness in each quadrant (or distance) using a mixed effects model correcting for distance (or quadrant), age, sex, and axial length.

