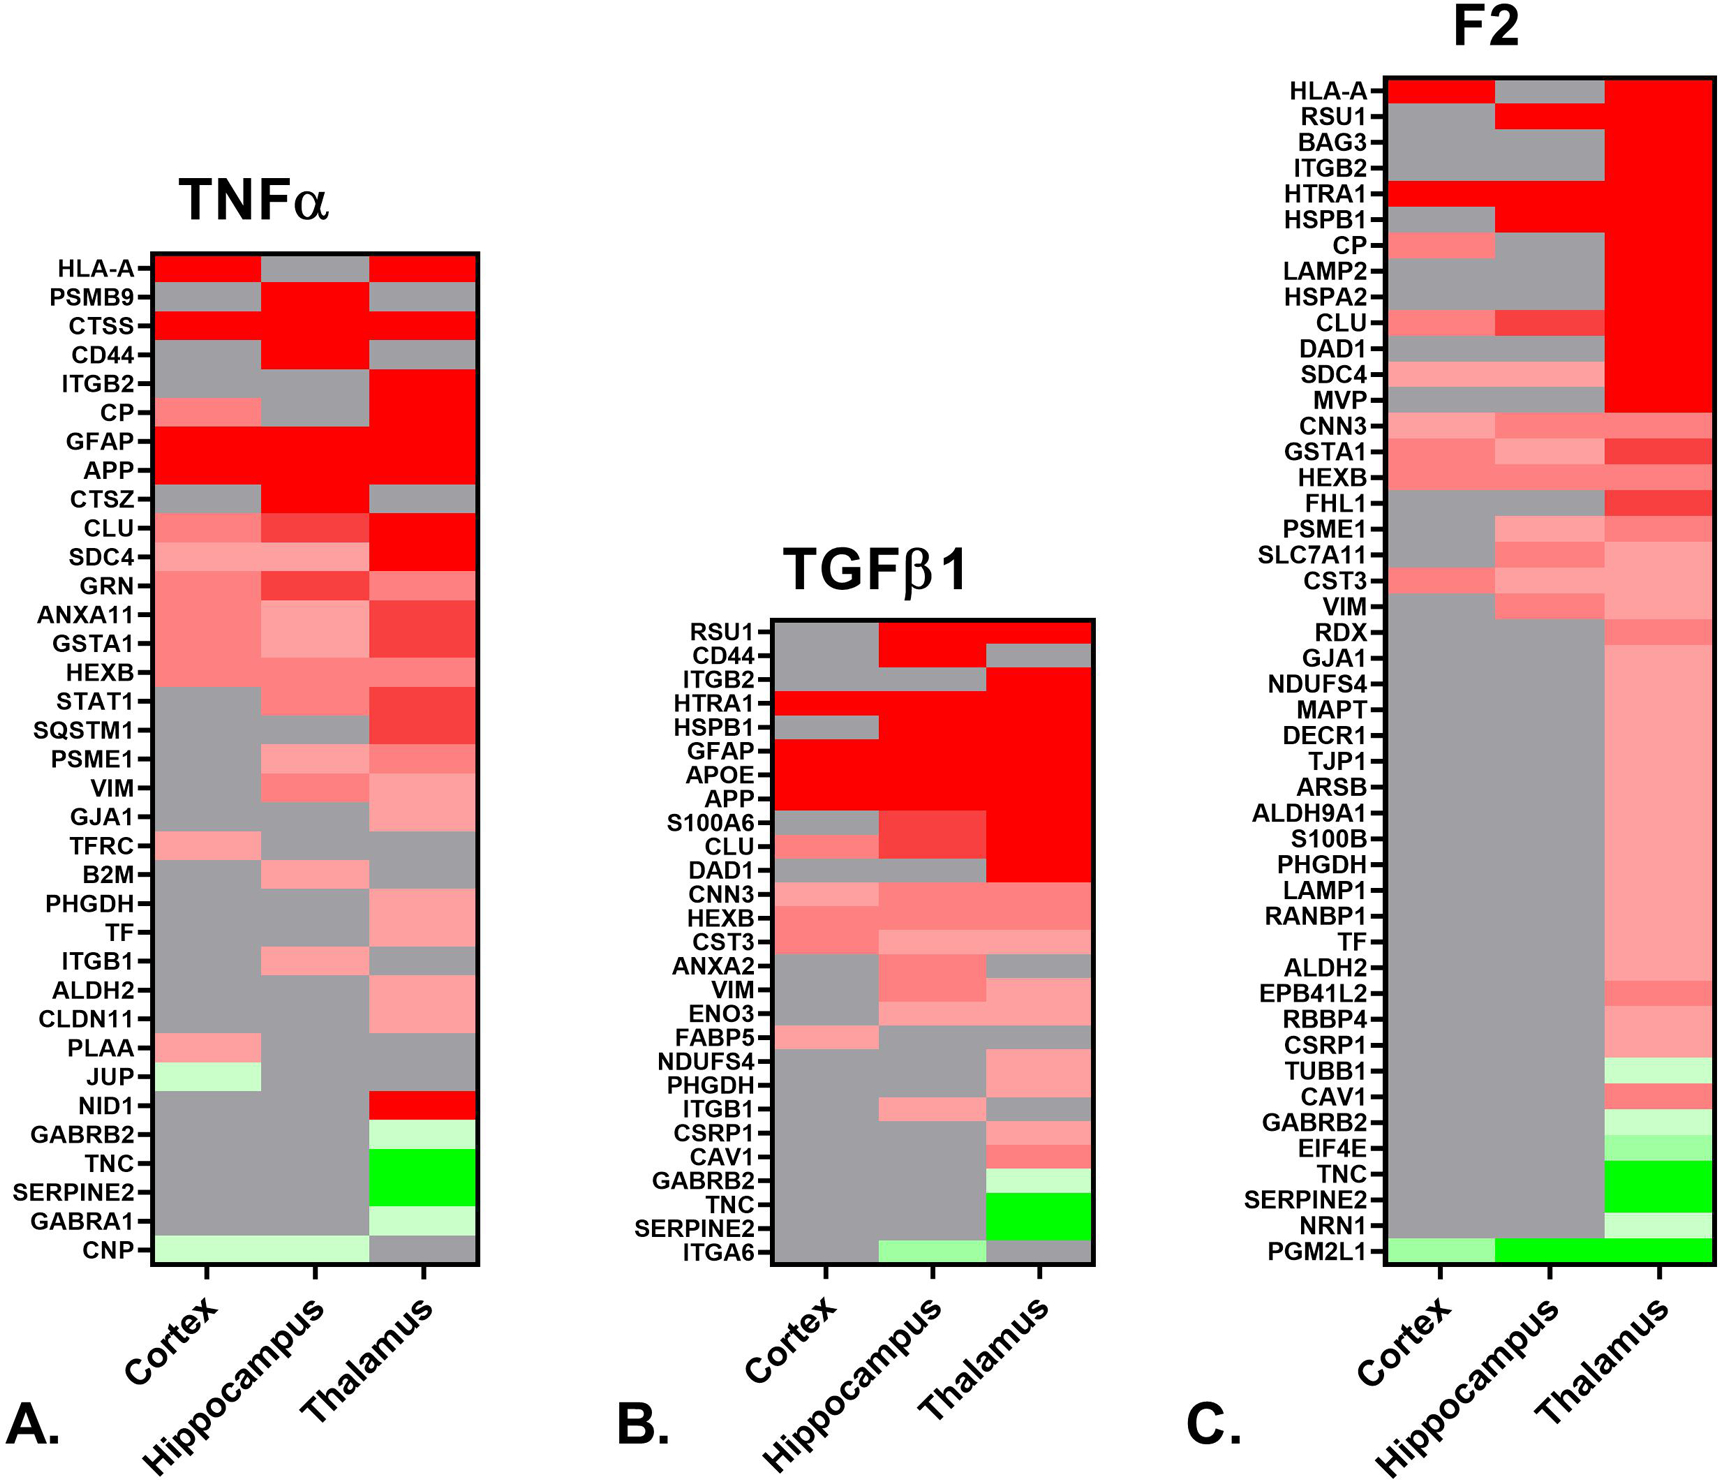
Figure 3. IPA identified upstream regulators and causal networks.

A. Heat map depicting the differentially expressed proteins (≥ 50% increase or ≥ 34% decrease, p < 0.05) in the cortex, hippocampus and thalamus of rTg-DI rats associated with upstream regulator TNFα. B. Heat map depicting differentially expressed proteins in the cortex, hippocampus and thalamus of rTg-DI rats associated with upstream regulator TGFβ1. C. Heat map depicting the differentially expressed proteins in the cortex, hippocampus, and thalamus of rTg-DI rats associated with the F2/Thrombin causal network. Red indicates increased, green decreased and grey not differentially expressed proteins, and color intensity correlates with degree of change.
