
Figure 5. Downstream effects analysis networks heat maps.
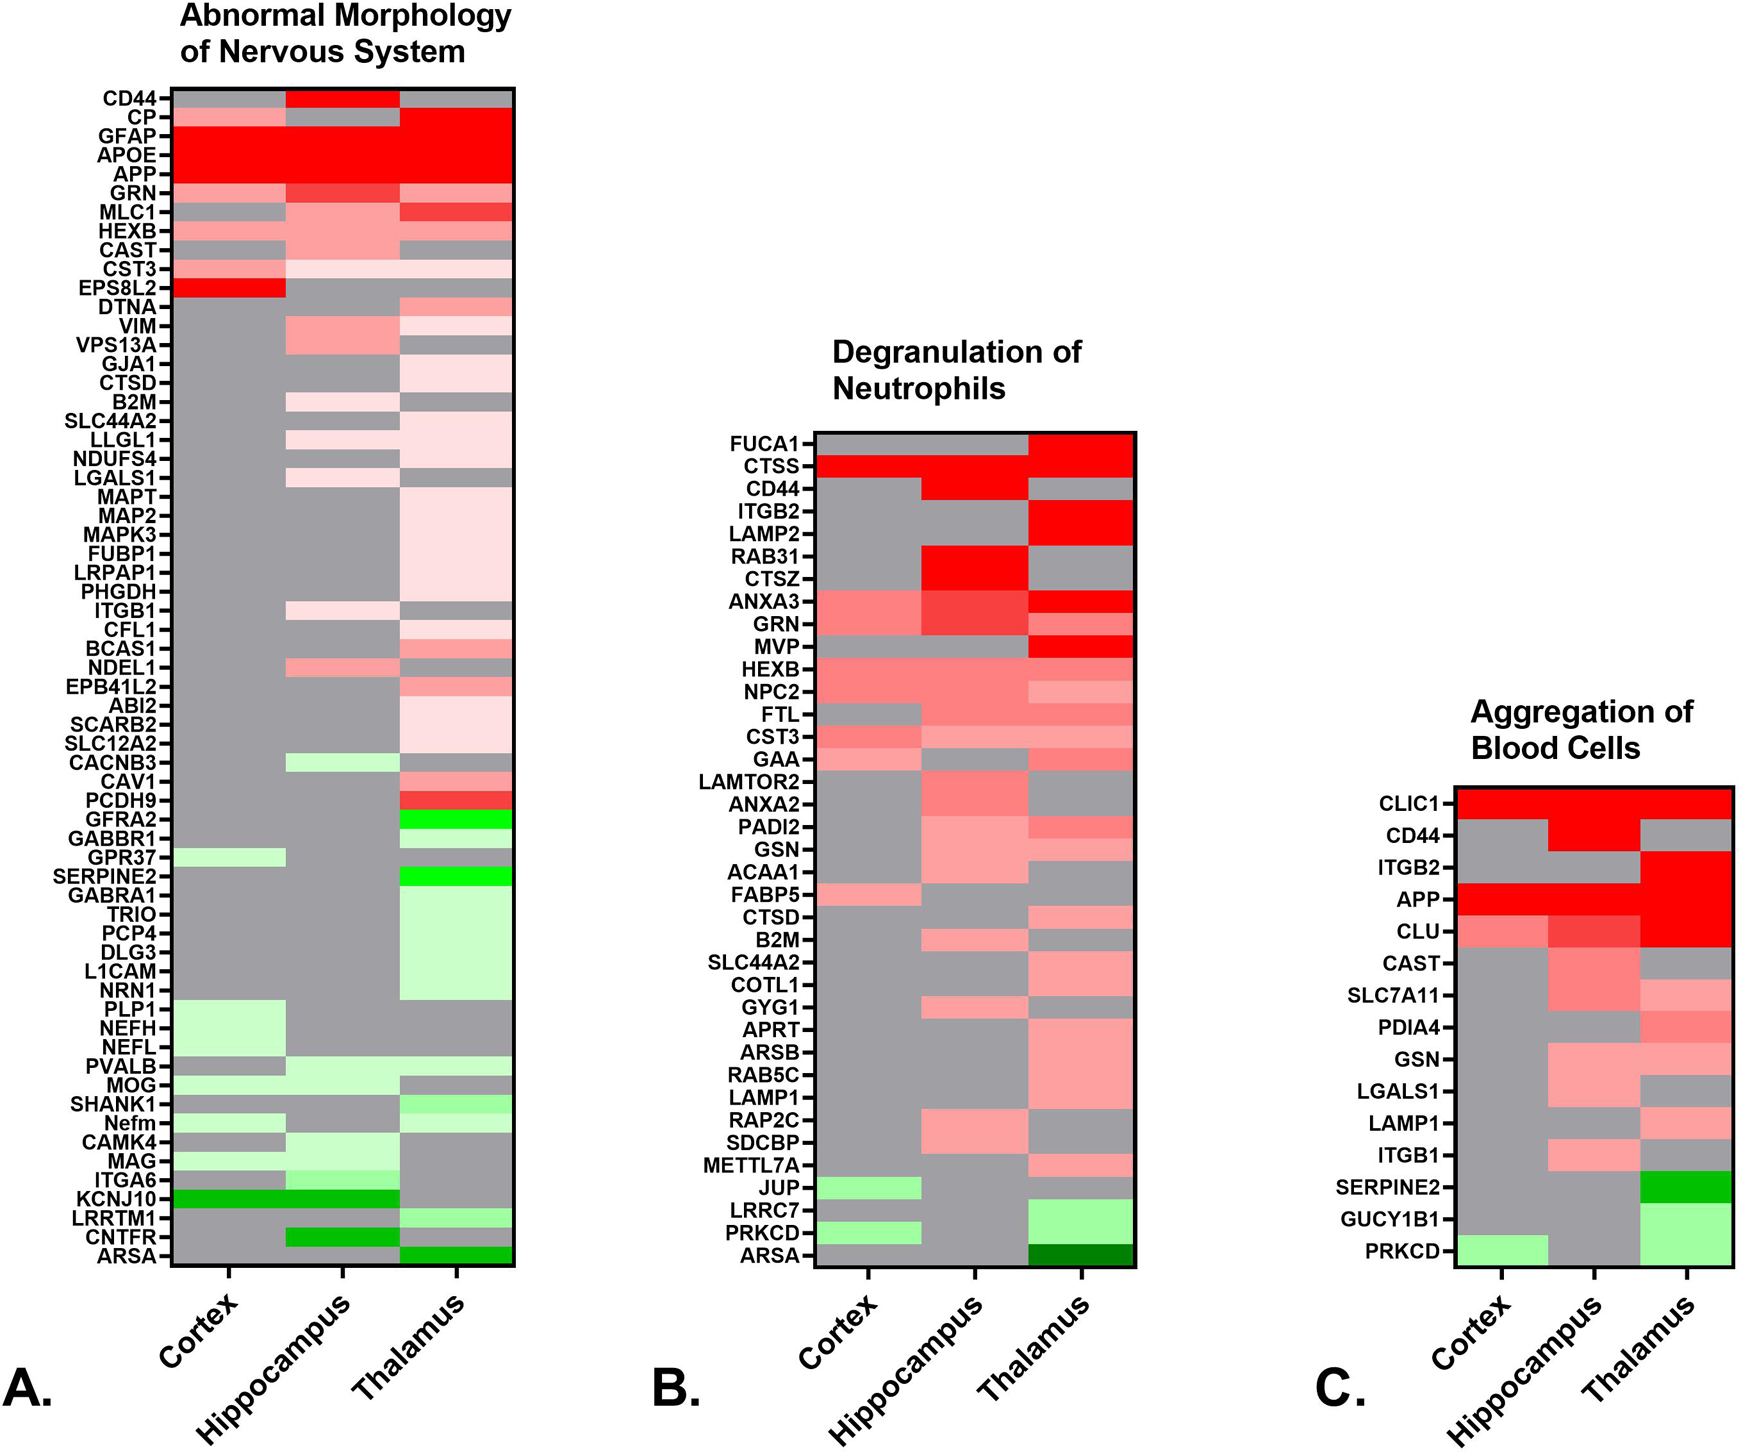
A. Heat map depicting the differentially expressed proteins (≥ 50% increase or ≥ 34% decrease, p < 0.05) in the cortex, hippocampus and thalamus of rTg-DI rats associated with abnormal morphology of the nervous system. B. Heat map depicting the differentially expressed proteins in the cortex, hippocampus and thalamus of rTg-DI rats associated with neutrophil degranulation. C. Heat map depicting the differentially expressed proteins in the cortex, hippocampus and thalamus of rTg-DI rats associated with aggregation of blood cells. Red indicates increased, green decreased, and grey not differentially expressed proteins, and color intensity correlates with degree of change.