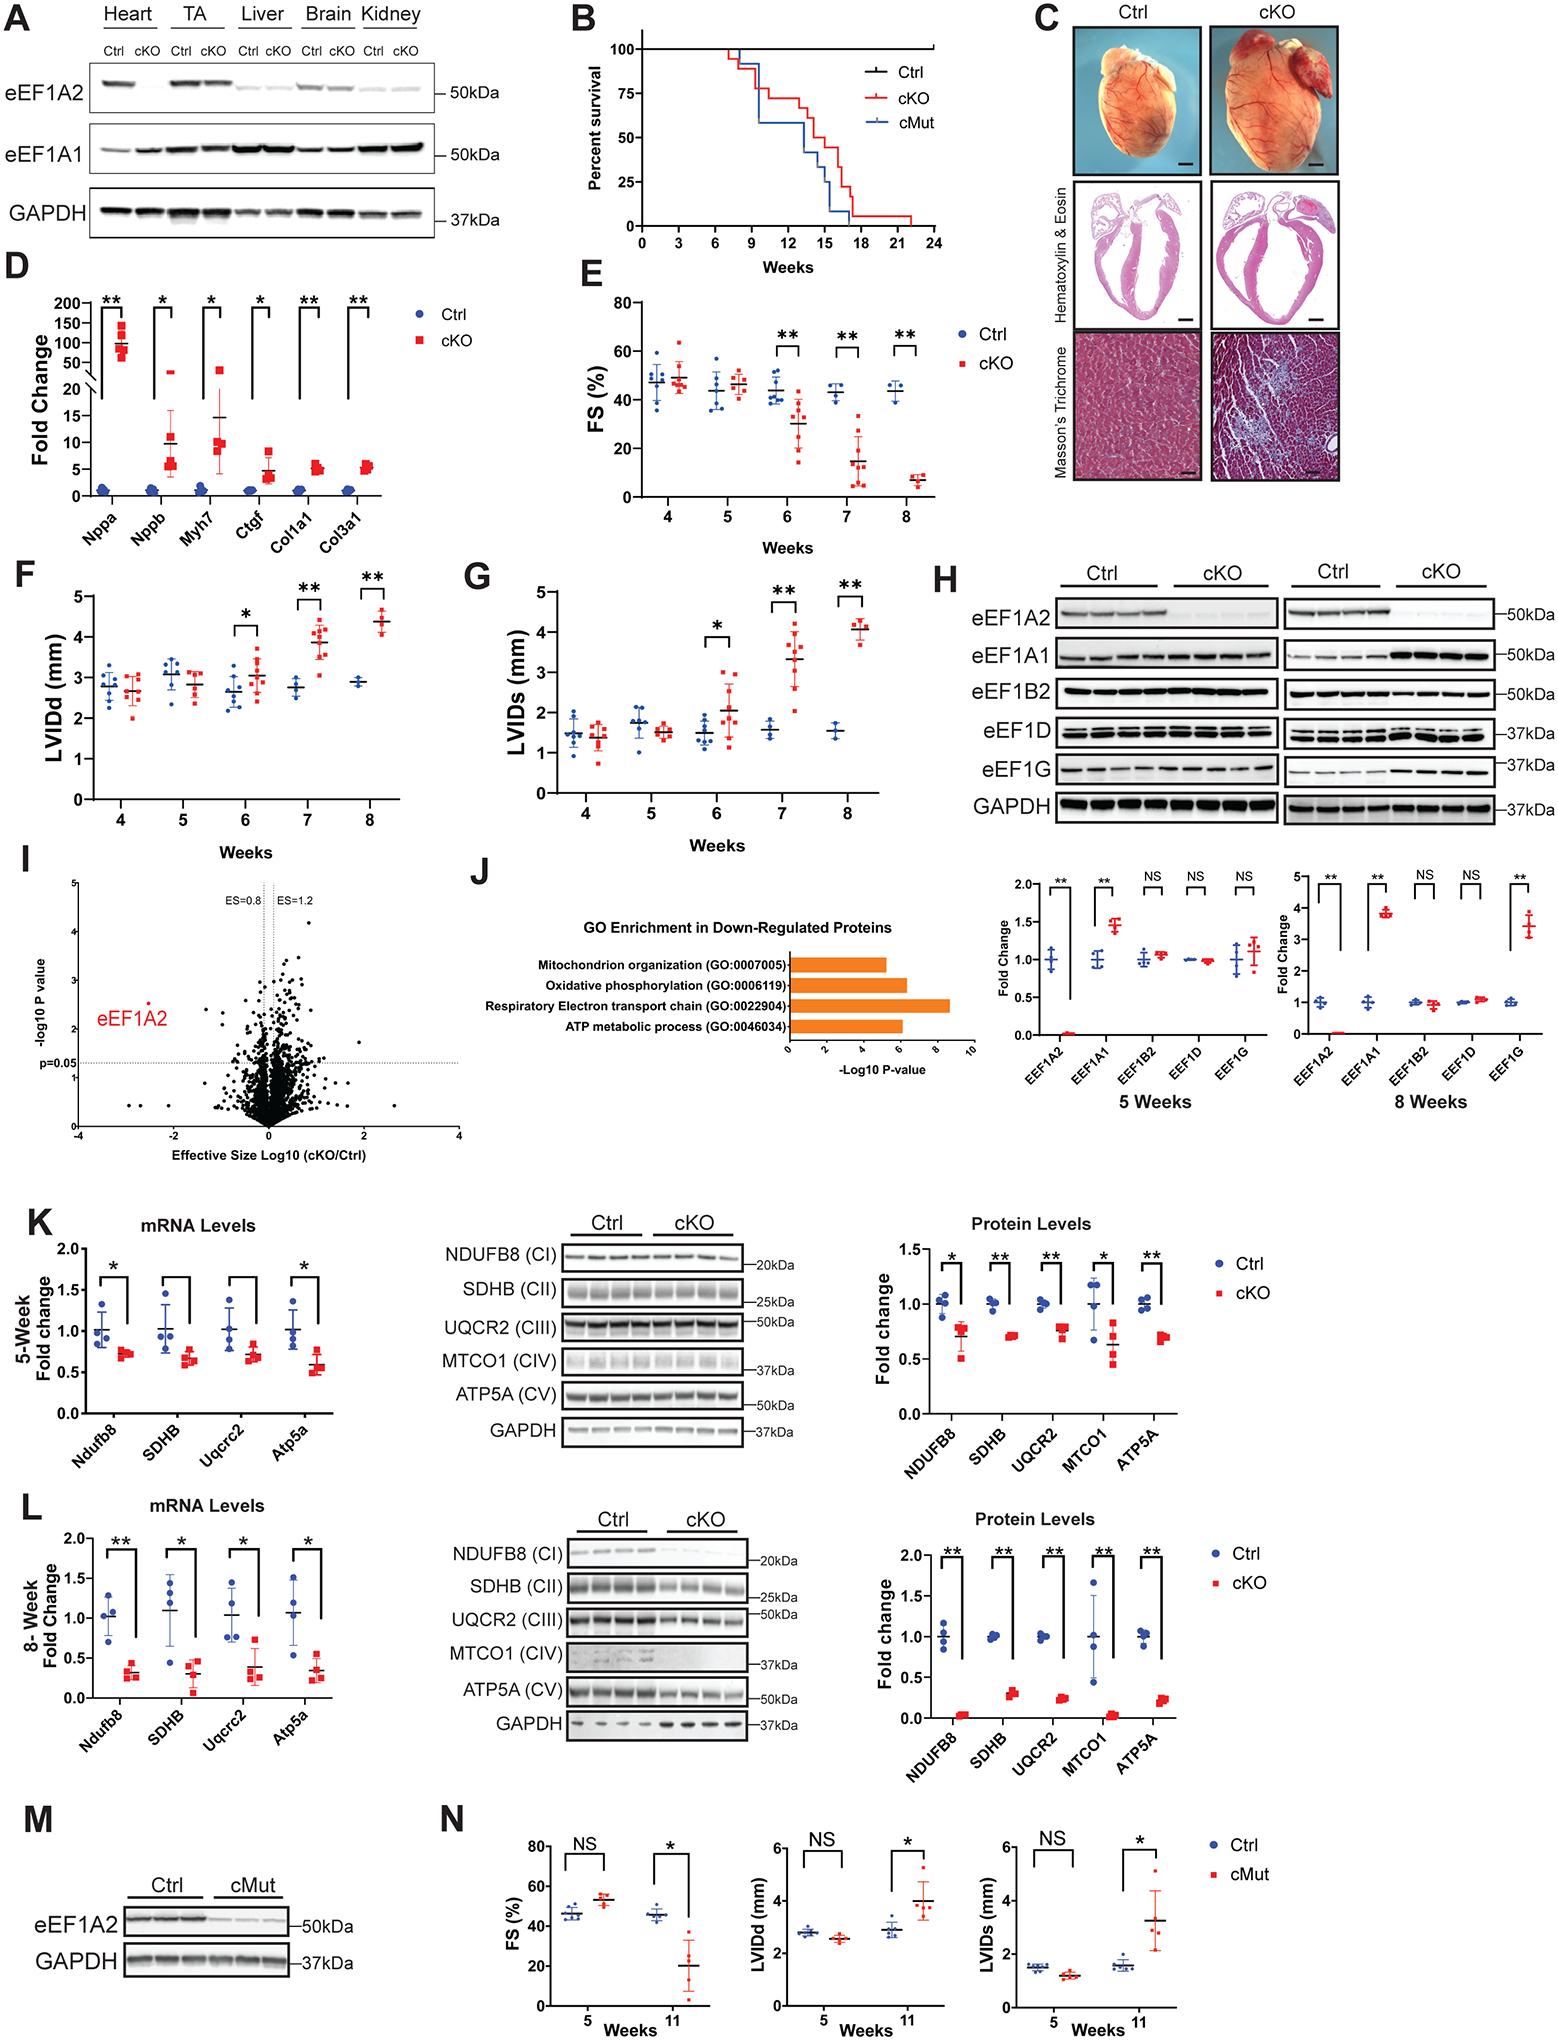
Figure. Loss or P333L mutation of eEF1A2 in murine myocardium results in dilated cardiomyopathy.

A, Western blot analysis of eEF1A2 and eEF1A1 in indicated tissues isolated from Cre-negative eEF1A2flox/flox (Ctrl) and eEF1A2flox/flox; Xmlc2-Cre+ (cKO) mice at 8 weeks of age. TA, tibialis anterior muscle. B, Kaplan-Meier survival curves of Ctrl (n=10), eEF1A2 cKO (n=18), and eEF1A2 P333L cMut (n=12) mice. C, Representative microscopic images of whole mouse hearts (top, scale bars: 1 mm), and cross-sectional views of H&E-stained (middle, scale bars: 1 mm) and Masson’s trichrome-stained (bottom, scale bars: 100 μm) hearts isolated from Ctrl and cKO mice at 8 weeks of age. D, qRT-PCR analysis of cardiac remodeling and fibrosis gene markers in Ctrl (blue, n=4–5) and cKO (red, n=4–5) mouse hearts at 8 weeks of age. E-G, Echocardiography measurements of (E) left ventricular (LV) systolic function (% of fractional shortening, FS) and LV internal diameter at (F) end-diastole (LVIDd) and (G) end-systole (LVIDs) in Ctrl (blue, n=4–6) and cKO (red, n=4–9) mice at 4, 5, 6, 7, and 8 weeks of age. H, Western blot (top) and corresponding quantification (bottom) analysis of eEF1B complex components in Ctrl (blue) and cKO (red) mouse hearts at 5 (left) and 8 (right) weeks of age. I, Volcano plot of protein expression changes between Ctrl and cKO 5-week-old ventricles (n=3). The region above the horizontal dashed line is the adjusted Bonferroni P value <0.05. Proteins with adjusted P<0.05 and effective size (ES) >1.2 or <0.8 are considered significantly upregulated or downregulated, respectively. J, Gene Ontology (GO) enrichment analysis of significantly downregulated proteins in cKO hearts by mass spectrometry (I) with ES <0.8 and P<0.05. GO terms for significantly downregulated biological processes are listed. K, Analysis of complex components of the mitochondrial respiratory electron transport chain (ETC) by qRT-PCR (left), western blot (middle), and corresponding quantification (right) analysis of ETC complex (C) proteins in Ctrl (blue, n=4) and cKO (red, n=4) hearts at 5 weeks of age. L, Analysis of ETC complex components by qRT-PCR (left), western blot (middle), and corresponding quantification (right) analysis of ETC complex (C) proteins in Ctrl (blue, n=4) and cKO (red, n=4) hearts at 8 weeks of age. M, Western blot analysis of eEF1A2 in eEF1A2flox/+; Xmlc2-Cre+ (Ctrl) and eEF1A2mut/flox; Xmlc2-Cre+ (cMut) mouse hearts at 8 weeks of age. N, Echocardiography measurements of LV systolic function (% FS), LVIDd, and LVIDs in Ctrl (blue, n=5) and cMut (red, n=4) mice at 5 and 11 weeks of age. Statistical analysis: Survival data were calculated using Kaplan-Meier survival analysis with a log-rank statistical method. For all other data, values are presented as mean ± standard deviation. For qRT-PCR and western blot analyses, data were normalized to corresponding Gapdh and GAPDH levels, respectively, and cKO or cMut was expressed as fold change versus Ctrl. A representative example of 3–5 independent experiments is shown. Statistical analysis was performed with a Student’s t-test or analysis of variance followed by Tuckey’s post-hoc test for multiple comparisons. P values of less than 0.05 were considered statistically significant (NS=not significant; *P<0.05; **P<0.01).
