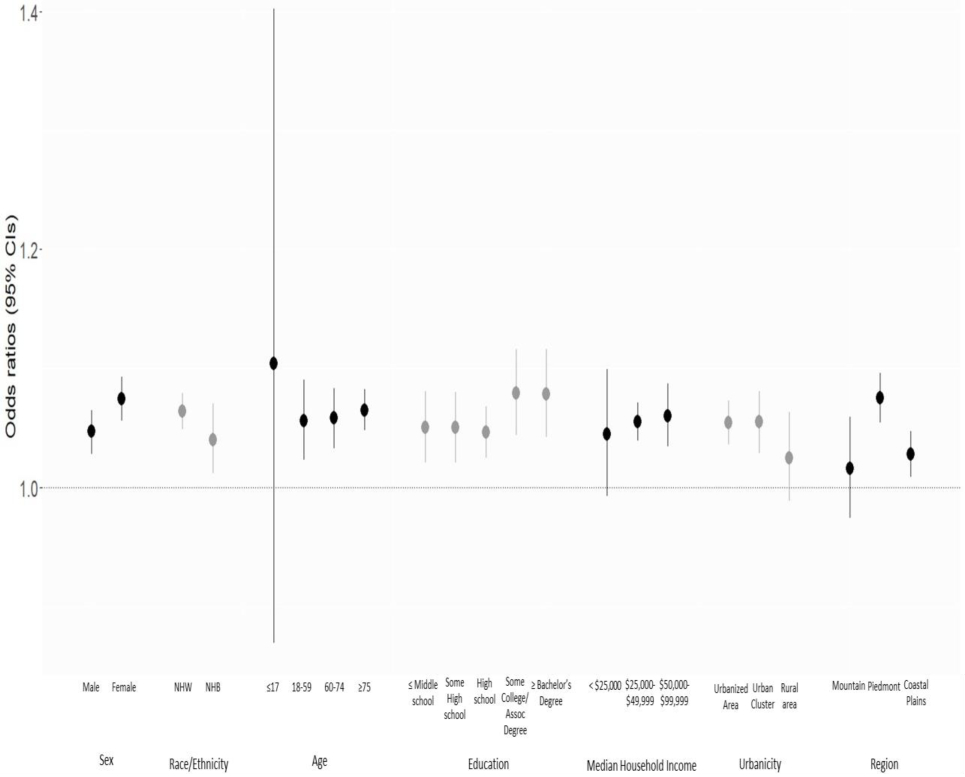
Figure 2.

Results of logistic regression analysis assessing the odds ratio for risk of cardiovascular mortality for the high exposure CAFOs group compared to the no CAFO exposure group, by individual- and community-level characteristics.
Note: NHW = non-Hispanic White. NHB = non-Hispanic Black. There was no estimate in > $99,999 median household income category due to no Census tracts with median income in the high exposure category.
