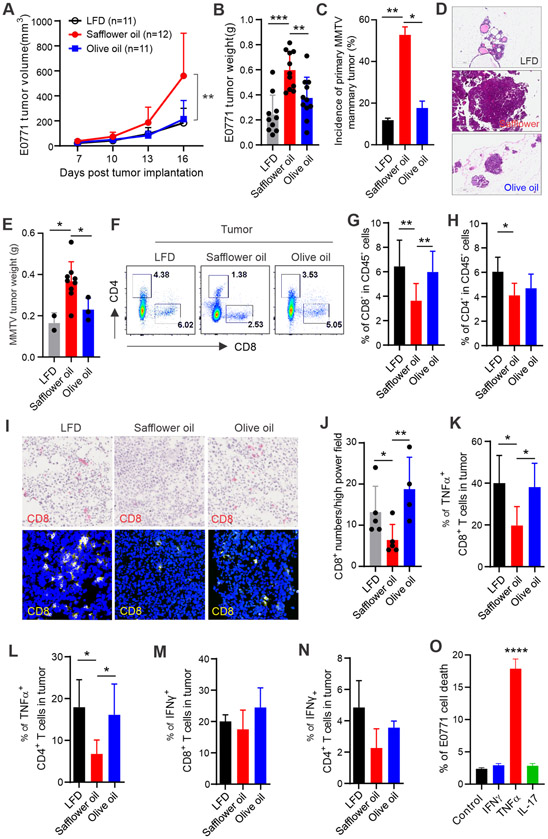
Figure 3. Safflower oil HFD-induced obesity is associated with impaired anti-tumor function of T cells.
(A) Mice on the LFD, safflower or olive oil HFD for 4 months were orthotopically injected with E0771 mammary tumor cells (0.5×10⁶). Tumor growth was monitored by measuring tumor size every 3 days for 16 days.
(B) E0771 tumor weight on 16 days post tumor injection in mice fed the LFD, safflower or olive oil HFD, respectively.
(C-E) Incidence of primary mammary tumors in two batches of MMTV-TGFα mice fed the LFD (n=17), safflower (n=17) or olive oil (n=18) HFD for 16 months. Representative H&E staining images of mammary tissues in each group of MMTV-TGFα mice are shown in panel D. Average tumor weight in each group is shown in panel E.
(F-H) Analysis of E0771 tumor infiltrating T cells in mice fed the LFD, safflower or olive oil HFD by flow cytometry. Average percentages of CD8+ and CD4+ T cells in alive CD45+ cells in the tumor stroma are shown in panel G and H, respectively.
(I, J) Analysis of CD8+ T cell infiltration in frozen E0771 tumor sections from mice fed the indicated diets by immunohistochemistry (red) and confocal (yellow) staining. Average numbers of CD8+ T cells per high power field of confocal microscopy are shown in panel J.
(K, L) Analysis of TNFα production in E0771 tumor infiltrating CD8+ (K) or CD4+ (L) T cells by flow intracellular staining.
(M, N) Analysis of IFNγ production in E0771 tumor infiltrating CD8+ (M) or CD4+ (N) T cells by flow intracellular staining.
(O) E0771 tumor cells were cultured with indicated T cell-derived cytokines for 48 hours and the percentage of the E0771 cell death were analyzed by Annexin V/7-AAD staining. Results represent 3 independent experiments.
Results represent 3 independent experiments. Data are shown as mean ± SEM (*p<0.05, **p<0.01, ****p<0.0001). Also see Figure S2.

