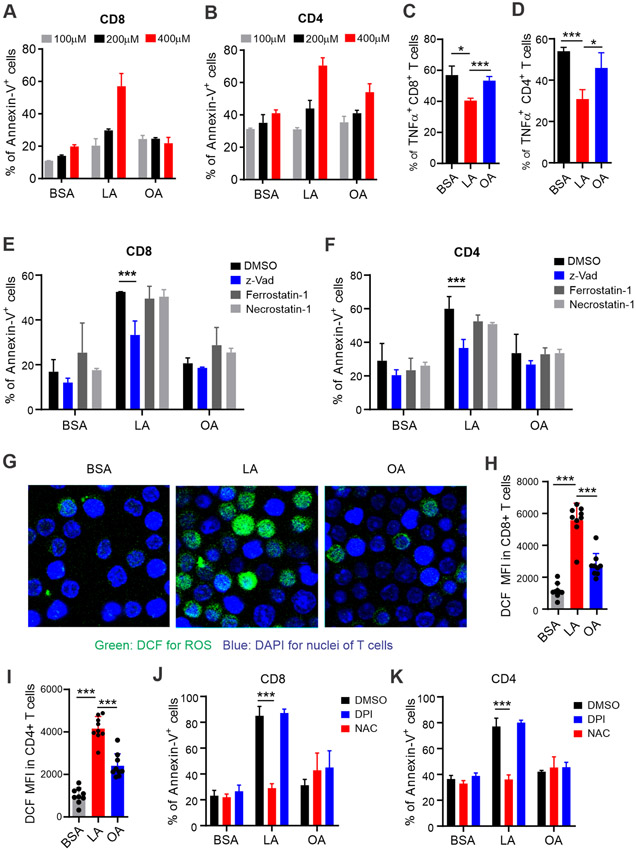
Figure 4. Analysis of apoptosis and ROS production in T cells treated with LA or OA in vitro.
(A, B) Splenocytes from normal wild type mice were treated with indicated concentrations of LA, OA or BSA for 20 hours. FA-induced cell death of CD8+ (A) and CD4+ (B) T cells were analyzed by flow cytometric annexin V staining.
(C, D) Splenocytes were treated with 400 μM LA, OA or BSA control in the presence of plate-bound ant-CD3(1μg/ml) and anti-CD28(1μg/ml) for 24 hours, PMA/ionomycin and BFA were added at the last 6 hours. Percentages of TNF-α production in CD8+(C) or CD4+ (D) T cells were measured by intracellular staining.
(E, F) Analysis of cell death of CD4+ or CD8+ T cells treated with BSA, LA, or OA (400μM) for 20 hours in the presence or absence of z-Vad, Ferrostatin-1 or Necrostatin-1 (1μM) by flow cytometry.
(G) Confocal microscopy analysis of ROS production as shown by DCF (green) in sorted T cells (DAPI, blue for nuclei) treated with BSA, LA or OA (400μM) for 30 mins.
(H, I) Measurement of fluorescent intensity of DCF in CD8+ (H) or CD4+ (I) T cells treated with 400μM LA, OA or BSA for 30 mins by flow cytometry.
(J, K) Cell death analysis of CD8+ (J) or CD4+ (K) T cells pretreated with DPI or NAC for 15mins before addition of BSA, LA, or OA (400μM) for 20 hours by flow cytometry.
Results represent 3 independent experiments. Data are shown as mean ± SEM (* p<0.05, *** p<0.001). Also see Figure S3.

