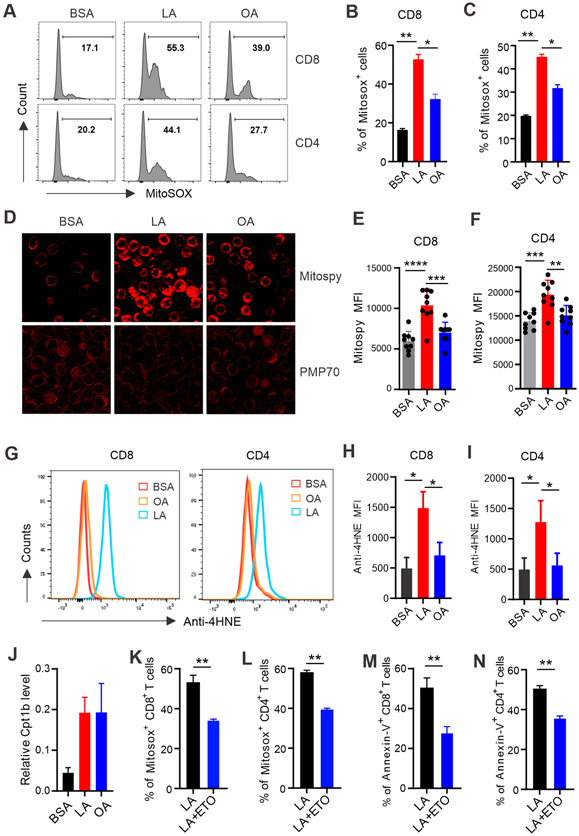
Figure 5. LA induces T cell death through promoting mitochondrial ROS production and lipid peroxidation.
(A-C) Splenic T cells purified from normal C57BL/6 mice were treated with 400μM LA, OA or BSA for 20 hours. Mitochondrial ROS production in CD8+ and CD4+ T cells were analyzed by MitoSox staining (n=8). Average percentages of Mitosox+ CD8+ and MitoSox+ CD4+ T cells in each group are shown in panel B and C, respectively.
(D) Confocal microscopy analysis of Mitospy™ NIR DiIC1 (top) and PMP70 (70-kDA peroxisomal membrane protein) (bottom) in sorted T cells treated with BSA, LA or OA for 30 mins.
(E, F) Mitochondrial potential in CD8+ (E) or CD4+ (F) T cells was measured by flow cytometry with Mitospy™ NIR DiIC1 staining.
(G-I) Splenic T cells were treated with BSA, LA or OA (400μM) for 4 hours. Representative histogram of anti-4-HNE (4-hydroxynonenal) lipid peroxidation staining in CD8+ or CD4+ T cells was shown in panel G. Mean fluorescent intensity (MFI) of anti-4-HNE in CD8+ and CD4+ T cells is shown in panel H and I, respectively.
(J) Real-time PCR analysis of Cpt1b gene expression in sorted T cells treated with BSA, LA, or OA (400μM) for 12 hours.
(K, L) Analysis of mitochondrial ROS production by Mitosox staining in CD8+ (K) or CD4+ (L) T cells treated with LA (400μM) in the presence or absence of etomoxir (1μM), a specific Cpt1 inhibitor, for 20 hours.
(M, N) Analysis of Annexin-V+ CD8+ (M) or CD4+ (N) T cells treated with LA (400μM) in the presence or absence of 1μM etomoxir for 20 hours.
Results represent 3 independent experiments. Data are shown as mean ± SEM (*p<0.05, **p<0.01, ***p<0.001, ****p<0.0001). Also see Figure S4.

