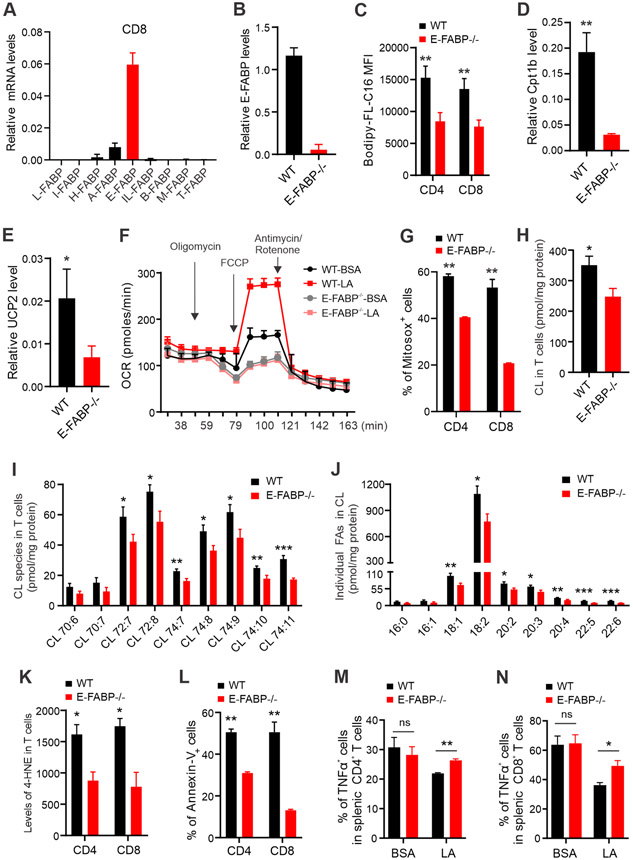
Figure 6. E-FABP expression mediates LA induced-mitochondria dysfunction in T cells.
(A) Analysis of expression profile of FABP family members in purified CD8+ T cells from the spleen of naïve mice by real-time PCR.
(B) Analysis of E-FABP expression in splenic CD8+ T cells purified from WT and E-FABP−/− mice.
(C) Analysis of the uptake of Bodipy-FL-C16 fatty acid by CD8+ or CD4+ T cells by flow cytometric staining.
(D, E) Real-time PCR analysis of Cpt1b (D) and Ucp2 (E) expression in splenic T cells purified from WT or E-FABP−/− mice after treatment with LA (400μM) overnight.
(F) Splenic T cells purified from naïve WT or E-FABP−/− mice were seeded in ant-CD3/CD28-coated wells and treated with BSA and LA (400uM). Oxygen consumption rate (OCR) was measured in the presence of injected drugs at the indicated time points by extracellular flux analysis.
(G) Splenic T cells purified from naïve WT and E-FABP−/− mice were treated with LA (400μM) for 20 hours. Percentage of Mitosox+ T cells was analyzed by flow cytometry.
(H-J) Splenic T cells purified from naïve WT and E-FABP−/− mice were treated with LA (400μM) overnight. Total (H) and individual (I) cardiolipin (CL) species and individual FAs in CLs (J) were measured by mass spectrometric analyses.
(K) Analysis of 4-HNE lipid peroxidation in LA-treated WT and E-FABP−/− T cells by flow cytometric staining.
(L) Analysis of LA-induced cell death in WT and E-FABP−/− T cells by Annexin-V staining.
(M, N) Splenic T cells purified from naïve WT or E-FABP−/− mice were respectively seeded in ant-CD3/CD28-coated wells and treated with BSA and LA (400uM) for 24h. PMA/ionomycin and BFA were added at the last 6 hours for analysis of intracellular production of TNFα. Representative dot plot and percentages of TNFα+ T cells are shown in panel M and N, respectively.
Results represent 4 independent experiments. Data are shown as mean ± SEM (n=3/group, *p<0.05, **p<0.01, ***p<0.001). Also see Figure S5.

