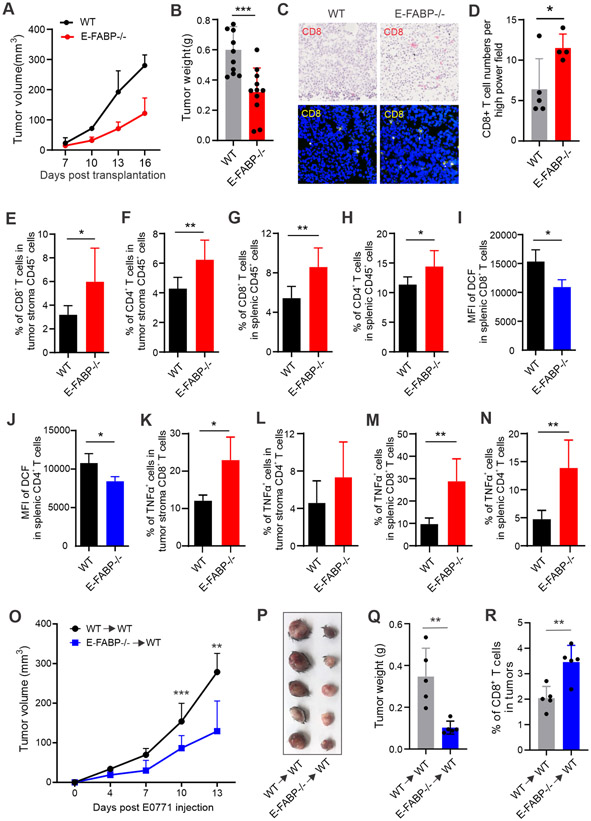
Figure 7. E-FABP deficiency mitigates safflower oil HFD-increased mammary tumor growth in vivo.
(A, B) WT (n=11) and E-FABP−/− mice (n=12) fed the safflower oil HFD for 4 months were orthotopically implanted E0771 mammary tumor cells (0.5×10⁶). (A) Tumor growth was monitored by measuring tumor size every 3 days for 16 days. (B) E0771 tumor weight in each group was measured 16 days post tumor injection.
(C, D) Analysis of CD8+ T cell infiltration in E0771 tumor sections from WT and E-FABP−/− mice by immunohistochemistry (red) and confocal (yellow) staining. Average numbers of CD8+ T cells per high power field of the confocal microscopy are shown in panel D.
(E, F) Analysis of the percentage of CD8+ (E) and CD4+ (F) T cells in alive CD45+ cells in E0771 tumors of WT and E-FABP−/− mice.
(G, H) Analysis of the percentage of splenic CD8+ (G) and CD4+ (H) T cells in E0771 tumor-bearing WT and E-FABP−/− mice.
(I, J) Flow cytometric analysis of DCF MFI in freshly isolated splenic CD8+ (I) or CD4+(J) T cells from tumor-bearing WT and E-FABP−/− mice.
(K, L) Intracellular staining of TNFα production in tumor infiltrating CD8+ (K) or CD4+ (L) T cells treated with PMA/ionomycin for 6 hours.
(M, N) Intracellular staining of TNFα production in splenic CD8+ (M) or CD4+ (N) T cells from E0771 tumor-bearing mice after treatment with PMA/ionomycin for 6 hours.
(O-R) CD8+ T cells purified from WT or E-FABP−/− mice fed the safflower oil HFD for 3 months were adoptively transferred into safflower oil-fed WT mice, respectively. Tumor growth was measured at the indicated time points post E0771 tumor cell implantation (5x10⁵/mouse) (O). Tumor size and average weight are shown in panel P and Q. Tumor infiltrating CD8+ T cells were analyzed by flow cytometric staining (R).
Data are shown as mean ± SEM (*p<0.05, **p<0.01, ***p<0.001). Also see Figure S6.

