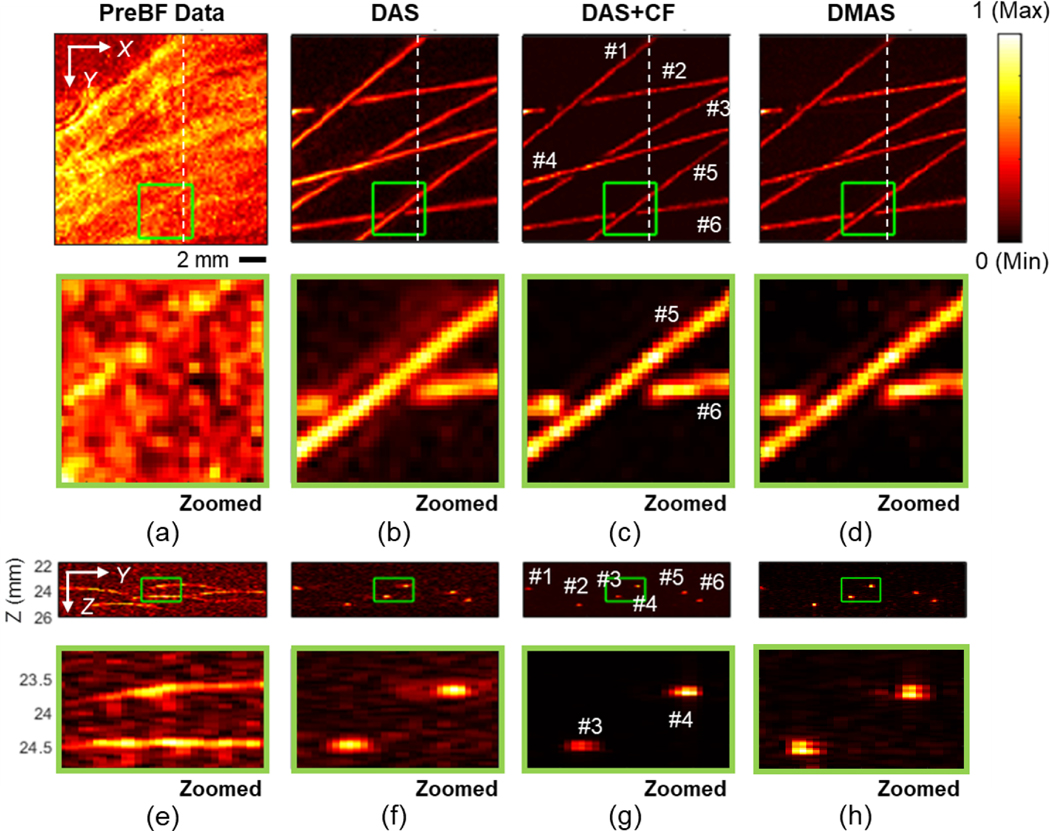
Fig. 10.
The PA imaging results of the microtube phantom placed at the depth of 24.5 mm from the transducer surface (12.1 mm from the focal depth of the transducer). (a) Pre-beamformed data, (b) DAS, (c) DAS+CF, and (d) DMAS reconstruction results with the images corresponding to cross-section slices at X = 10 mm position (e) – (h) are presented. The depth axis unit presents the distance from the transducer surface (the focal depth is 12.4 mm). The color bar represents the normalized PA intensity.

