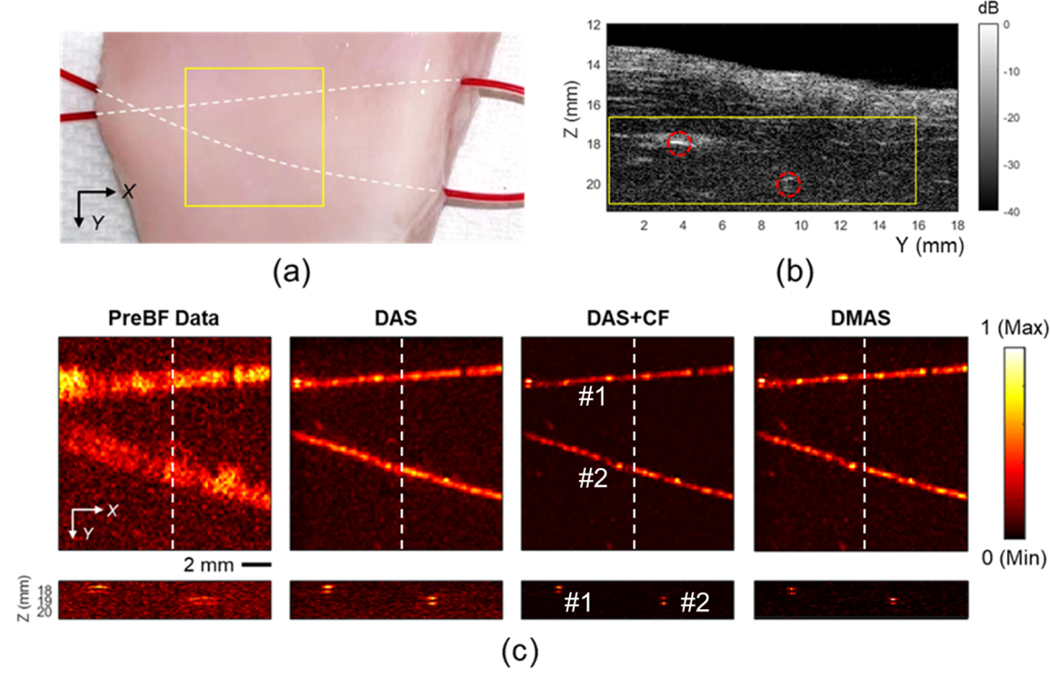
Fig. 11.
The results of the ex-vivo study. (a) The picture of the chicken breast sample with the mouse blood-contained microtube embedded. The yellow region covers the imaging area. (b) The ultrasound image of the sample corresponding to the cross-section slice at X = 10 mm position in the PA image. The tube locations are highlighted in red. (c) The PA images of the sample with pre-beamformed data and DAS, DAS+CF, and DMAS reconstruction results (first row) and the corresponding cross-section slices at X = 10 mm position (second row). The depth axis unit presents the distance from the transducer surface (the focal depth is 12.4 mm). The color bar represents the normalized PA intensity.

