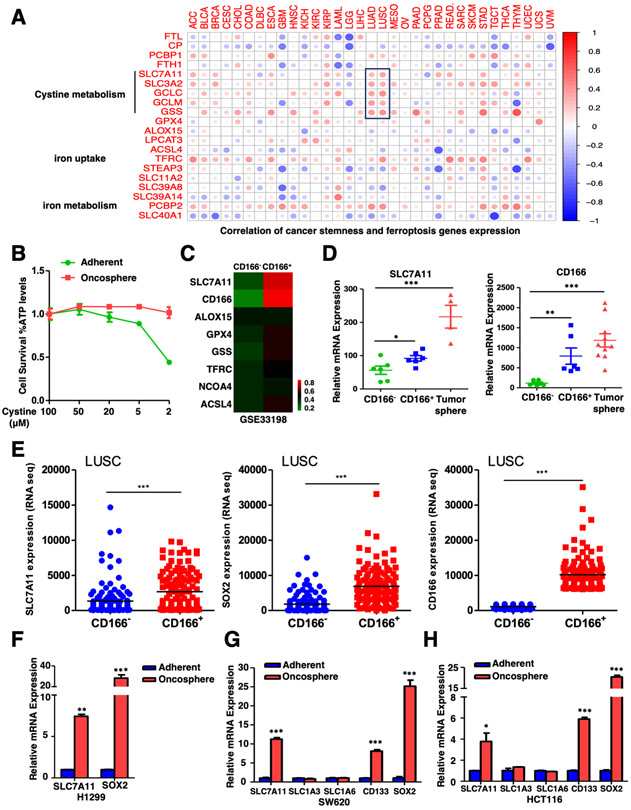
Figure.1. Cystine transporter SLC7A11 is upregulated in CSLCs.
A. Correlation between cancer stemness and ferroptosis genes expression in 33 tumor types was shown. The Kruskal test in R was used to test the correlation, P value < 0.05 was considered statistically significant. ACC (Adrenocortical Carcinoma), BLCA (Bladder Urothelial Carcinoma), BRCA (Breast Invasive Carcinoma), CESC (Cervical Squamous Cell Carcinoma and Endocervical Adenocarcinoma), CHOL (Cholangiocarcinoma), COAD (Colon Adenocarcinoma), DLBC (Lymphoid Neoplasm Diffuse Large B-cell Lymphoma), ESCA (Esophageal Carcinoma), GBM (Glioblastoma Multiforme), HNSC (Head and Neck Squamous Cell Carcinoma), KICH (Kidney Chromophobe), KIRC (Kidney Renal Clear Cell Carcinoma), KIRP (Kidney Renal Papillary Cell Carcinoma), LAML (Acute Myeloid Leukemia), LGG (Brain Lower Grade Glioma), LIHC (Liver Hepatocellular Carcinoma), LUAD (Lung Adenocarcinoma), LUSC (Lung Squamous Cell Carcinoma), MESO (Mesothelioma), OV (Ovarian Serous Cystadenocarcinoma), PAAD (Pancreatic Adenocarcinoma), PCPG (Pheochromocytoma and Paraganglioma), PRAD (Prostate Adenocarcinoma), READ (Rectum Adenocarcinoma), SARC (Sarcoma), SKCM (Skin Cutaneous Melanoma), STAD (Stomach Adenocarcinoma), TGCT (Testicular Germ Cell Tumors), THCA (Thyroid Carcinoma), THYM (Thymoma), UCEC (Uterine Corpus Endometrial Carcinoma), UCS (Uterine Carcinosarcoma) and UVM (Uveal Melanoma).
B. H1299 adherent and oncosphere cells were cultured in different concentrations of cysteine for 24 hours and cell viability of indicated cells was measured. The data was representative of three independent experiments.
C. Gene expression data of CD166− control and CD166+ lung CSLCs was obtained from GEO (GSE33198) and heatmap of ferroptosis related gene expression was shown.
D. Expression levels of SLC7A11 and CD166 in CD166− control cells, CD166+ lung CSLCs and lung tumor sphere were showed, *P<0.05, **P<0.01, ***P<0.001 (Student's t-test).
E. Expression levels of SLC7A11, SOX2 and CD166 in CD166− versus CD166+ lung tumor cells from TCGA database were showed as dot plots, The data represented as scatter dot plot and the line showed mean. Significance was assessed by the Wilcoxon test compared between the indicated two groups, ***P<0.001 (Student's t-test).
F. SLC7A11 was upregulated in H1299 tumor oncospheres when compared with adherent cells, **P<0.01, ***P<0.001 (Student's t-test).
G. SLC7A11 but not other transporters was upregulated in SW620 tumor oncospheres when compared with adherent cells, ***P<0.001 (Student's t-test).
H. SLC7A11 but not other transporters was upregulated in HCT116 tumor oncospheres when compared with adherent cells, *P<0.05, ***P<0.001 (Student's t-test).

