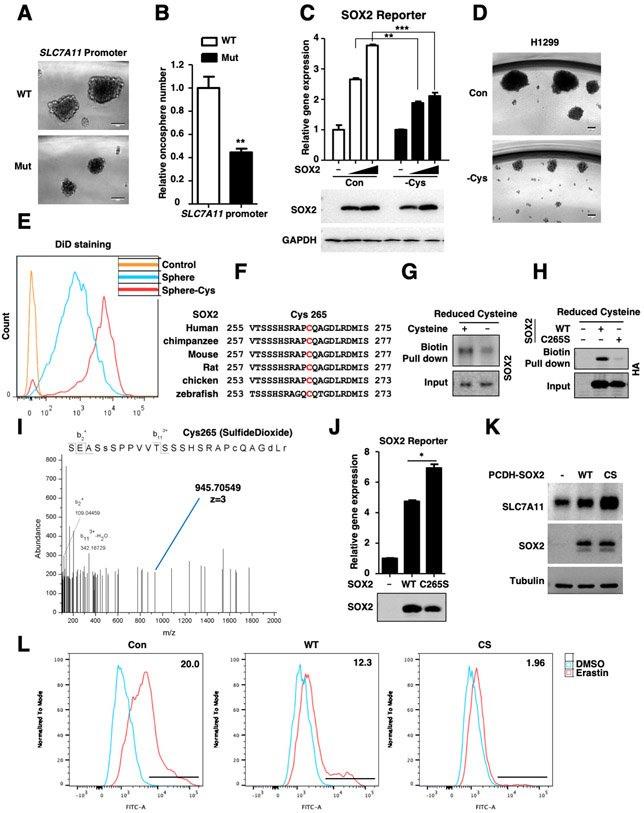
Figure.5. Cysteine deprivation induces SOX2-Cys265 oxidative modification.
A. Representative sphere images derived from SLC7A11 promoter WT and mutant H1299 cells. Scale bar: 100 μm.
B. Relative tumor spheres number derived from SLC7A11 promoter WT and mutant cells, **P < 0.01 versus WT (Student’s t test).
C. SOX2 activity reporter gene was co-expressed with different dose of SOX2 in HEK293T cells for 24 hours, then the cells were treated with cysteine deprivation for 6 hours or not, and the expression of Luciferase was measured and normalized to Renilla, **P<0.01, ***P<0.001 (two-way ANOVA test). The protein levels were analyzed by WB. Cysteine deprivation had little effect on expression level of SOX2.
D. Representative sphere images derived from H1299 cells treated with cysteine deprivation for 14 days or not, Scale bar: 100 μm.
E. DiD staining assay was performed to test the self-renewal of H1299 CSLCs. DiD, the cell labeling dye which is quite stable in cells, will decrease upon cell division. CSLCs treated with cysteine deprivation showed slower cell renewal rate compared to that cultured in normal medium.
F. Sequence alignment of SOX2 Cys265 across different species.
G. H1299 cells were treated with cysteine deprivation for 6 hours or not, the cell lysate was incubated with maleimide-biotin to label reduced cysteine groups. Pull-down of biotin-labeled proteins was followed by WB.
H. HA-SOX2 and C265S mutant were transfected in HEK293T cells for 24 hours, the cell lysate was incubated with maleimide-biotin to label reduced cysteine groups. Pull-down of biotin-labeled proteins was followed by WB.
I. Tandem mass spectrometry spectrum of Glu-C-digested SOX2 fragment containing the oxidized cysteine residues (blue line) was shown.
J. SOX2 activity reporter gene was co-expressed with SOX2 WT or C265S mutant plasmids in HEK293T cells for 24 hours, the expression of Luciferase was measured and normalized to Renilla, *P<0.05 (Student's t-test). The protein levels were analyzed by WB.
K. The protein levels of SLC7A11 and SOX2 in indicated H1299 cells were analyzed by WB.
L. Lipid ROS levels of indicated H1299 cells treated with 5 μM Erastin for 10 hours.

