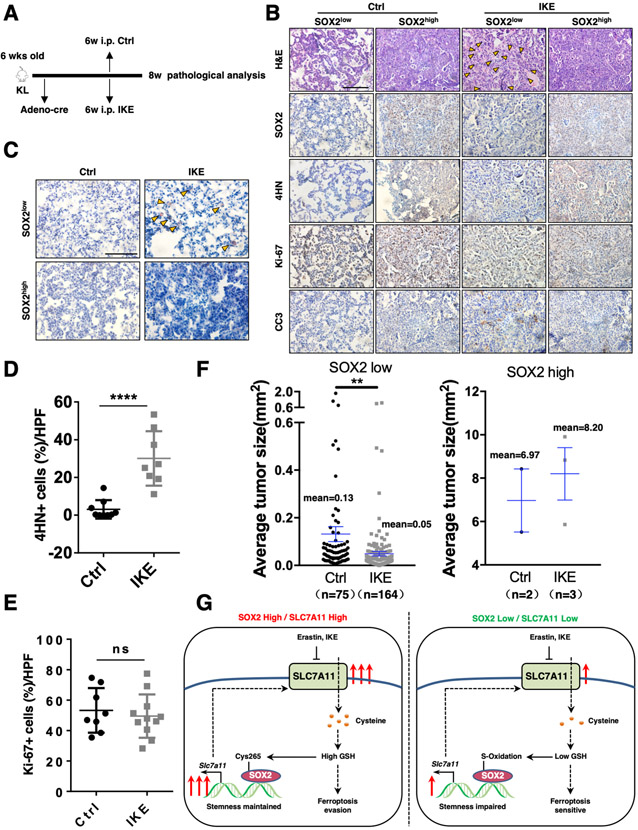
Figure.7. SOX2 high lung tumors are more resistant to IKE treatment versus SOX2low tumors.
A. The scheme of IKE treatment. The KL mice at 6 weeks post Ad-Cre infection were treated with IKE for 2 weeks, followed by tumor analysis.
B. Representative H&E and IHC staining of SOX2, 4HN, Ki-67 and CC3 of Ad-Cre-infected KL mice from control and IKE groups, yellow arrowheads indicated lipid droplets. Scale bar: 100 μm.
C. Oil Red O staining of IKE treated tumors showing lipid droplets (in red) of large size. Scale bar: 100 μm.
D. Statistical analysis of the percentage of 4HN+ cells in the lung tumors control and IKE groups in Ad-Cre-infected KL mice. Data was shown as mean ± SEM. Significance was assessed by the Wilcoxon test compared between the indicated two groups, ****P<0.0001. IKE treatment induced higher levels of 4HN.
E. Statistical analysis of the percentage of Ki-67+ cells in the lung tumors control and IKE groups in Ad-Cre-infected KL mice. Data was shown as mean ± SEM. Significance was assessed by the Wilcoxon test, ns, not significant. IKE treatment had little effect on Ki-67 levels.
F. Quantification of individual tumor size of Ad-Cre-infected KL mice from control and IKE groups. Data was shown as mean ± SEM. Significance was assessed by the Wilcoxon test compared between the indicated two groups, **P<0.01. IKE treatment decreased the tumor size of SOX2 low but not SOX2 high tumors.
G. Model of SOX2-SLC7A11 regulation axis.

