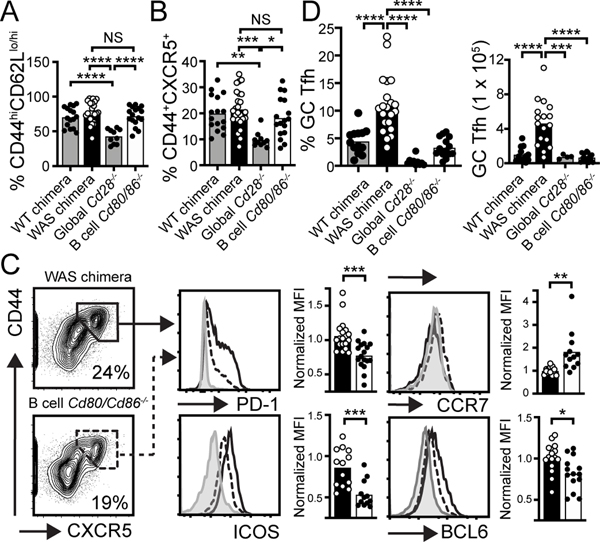
Figure 1: B cell-derived costimulatory signals promote Tfh differentiation.
(A, B) % CD44hiCD62Llo/hi EM (A) and CD44+CXCR5+ (B) within CD4+ compartment in indicated chimeras. (C) FACS plot (gated on CD4+; % in gate) show strategy to identify CD44+CXCR5+ T cells. Histograms show Tfh markers PD1, ICOS, CCR7, and BCL-6 in CD44+CXCR5+CD4+ T cells from WAS (solid line) and B cell-intrinsic Cd80−/−.Cd86−/− WAS (dashed line) chimeras. Gray histogram: CD44−CXCR5− naïve CD4+ T cells. Graphs: MFI of indicated markers (normalized to WAS chimera for each independent experiment) in WAS (open circle) and B cell-intrinsic Cd80−/−.Cd86−/− WAS (solid circle) chimeras. (D) Splenic CD44+CXCR5hiPD1hiICOShi “GC” Tfh cells (Left: % of CD4+; Right: number). (A-D) *, P<0.05; **, P<0.01; ***, P<0.001; ****, P<0.0001, by one-way ANOVA and Tukey’s multiple comparison test (A, B, D), and by two-tailed Student’s t test (C). Each data point indicates individual animal.

