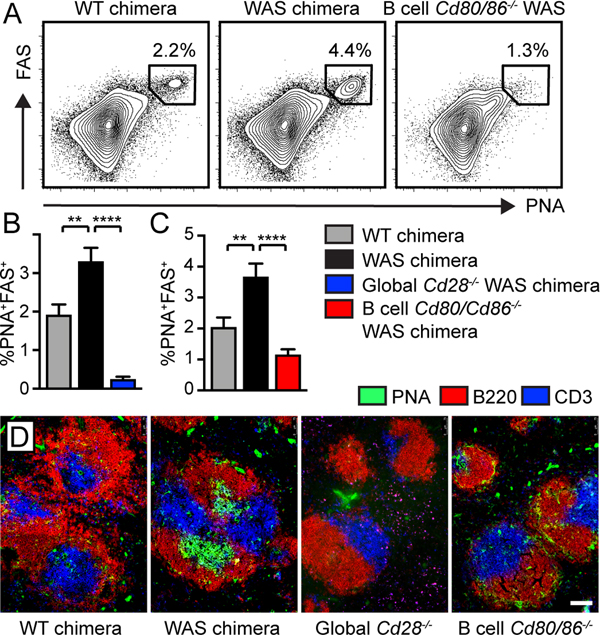
Figure 2: B cell costimulatory signals are required for autoimmune GC formation.
(A) FACS plots (gated on CD19+ B cells; % in gate) showing PNA+FAS+ GC B cells. (B,C) % PNA+FAS+ GC B cells (of total CD19+ B cells) in global Cd28−/− WAS (B) and B cell-intrinsic Cd80−/−.Cd86−/− WAS chimeras (C). Error bars indicate SEM. **, P<0.01; ****, P<0.0001, by one-way ANOVA, followed by Tukey’s multiple comparison test. (D) Splenic sections stained with B220 (red), PNA (green) and CD3 (blue); bars, 100μm.

