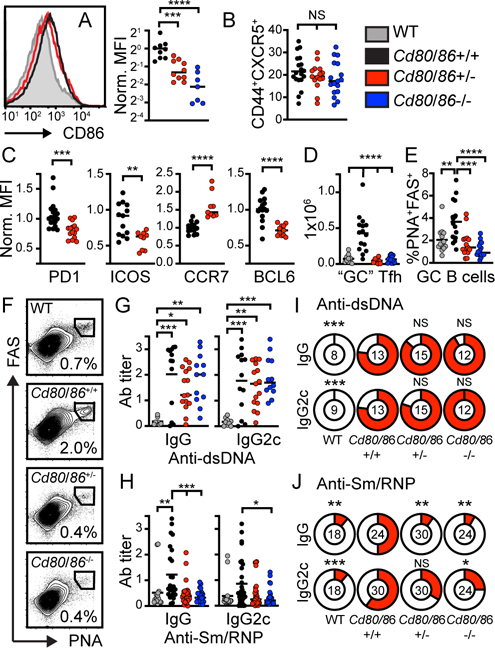
Figure 4: B cell-intrinsic CD80/CD86 heterozygosity prevents spontaneous GC formation.
(A) Left: Histogram showing modest reduction in B cell CD86 in B cell-intrinsic Cd80/Cd86+/− (red) vs. Cd80/Cd86+/+ (black) WAS chimeras. Gray histogram: Cd80/Cd86−/− control. Right: CD86 MFI (normalized to WAS chimera) on CD19+ B cells from indicated models. (B) % CD44+CXCR5+ (of total CD4+ T cells). (C) Normalized PD1, ICOS, CCR7, and BCL-6 MFI on CD4+CD44+CXCR5+ T cells from Cd80/Cd86+/+ (black) and B cell-intrinsic Cd80/Cd86+/− heterozygous (red) WAS chimeras. (D) Splenic CD4+CXCR5hi CD44hiPD1hiICOShi “GC” Tfh cells. (E) %PNA+FAS+ GC B cells (of total CD19+ B cells). (F) FACS plots (gated on CD19+ B cells) showing loss of PNA+FAS+ GC B cells with homo- and heterozygous Cd80/Cd86 deletion. (G, H) Anti-dsDNA (G) and anti-Sm/RNP (H) IgG and IgG2c autoAb. (I, J) Pie chart showing percentage of individual animals positive for anti-dsDNA (I) and anti-Sm/RNP (J) IgG and IgG2c autoAb (positive cut-off = mean + 3 S.D. for WT chimera control; number indicates animals analyzed per genotype). (A, C, D, F, G, H, I, J) *, P<0.05; **, P<0.01; ***, P<0.001; ****, P<0.0001; NS, not significant; by one-way ANOVA and Tukey’s multiple comparison test (A, C, D, F, G, H), and Fisher’s exact test (I, J). Each data point equals individual animal.

