. 2021 Aug 30;81(20):5230–5241. doi: 10.1158/0008-5472.CAN-20-1496

Figure 1.

Figure 1. Transcriptome juxtaposition and targeted screens identify LPAR1. A, Volcano plot for genes selected from RNA-seq and microarray data. Highlighted are best novel genes enriched in melanoma and NCLSC cultures relative to melanocytes by fold change and Padjusted (for RNA-seq: P < 10–10 or fold < 4, for microarrays: P < 10–6 or fold < 4). B, Scatter plot showing the averaged results of the targeted siRNA screen in 1205Lu and WM1366 cells. The x-axis represents the normalized growth and the y-axis represents each individual gene from 1–253. Four individual siRNAs against each gene were used. The blue dots represent the siEIF4A3 and the green dots represent nonspecific siRNAs as negative control. C, The top 30 genes identified in the primary screen were used for the secondary screen. D, Ingenuity Pathway Analysis of the top 30 genes in the screen identifies the LPAR1-RAP1A axis as the most significant network among the gene candidates. E, Relative gene expression levels of LPAR1 in melanoma, NCLSC, and melanocytes assayed by qRT-PCR. Biological replicates (n = 3) for each condition are included.

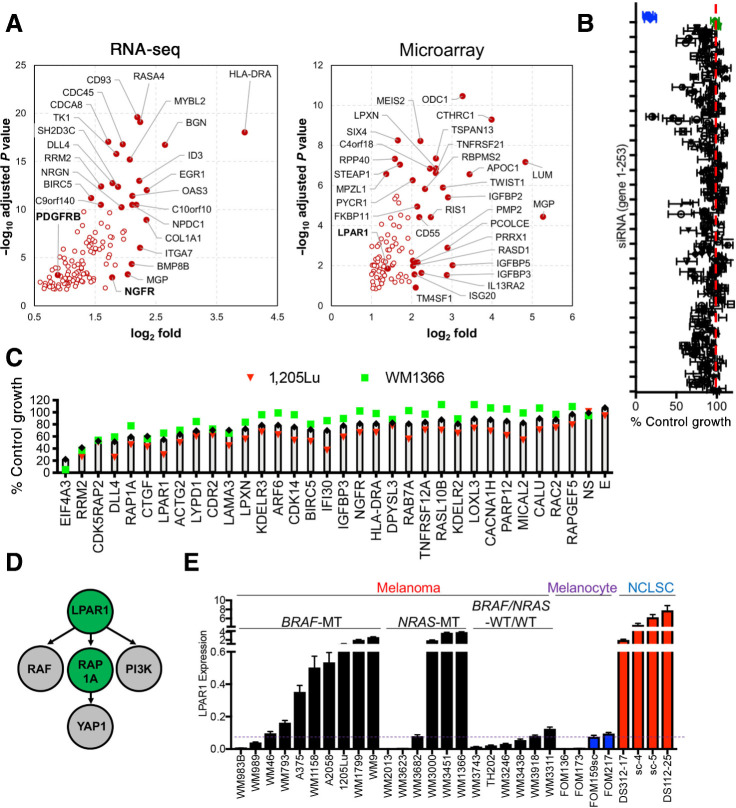
Transcriptome juxtaposition and targeted screens identify LPAR1. A, Volcano plot for genes selected from RNA-seq and microarray data. Highlighted are best novel genes enriched in melanoma and NCLSC cultures relative to melanocytes by fold change and Padjusted (for RNA-seq: P < 10–10 or fold < 4, for microarrays: P < 10–6 or fold < 4). B, Scatter plot showing the averaged results of the targeted siRNA screen in 1205Lu and WM1366 cells. The x-axis represents the normalized growth and the y-axis represents each individual gene from 1–253. Four individual siRNAs against each gene were used. The blue dots represent the siEIF4A3 and the green dots represent nonspecific siRNAs as negative control. C, The top 30 genes identified in the primary screen were used for the secondary screen. D, Ingenuity Pathway Analysis of the top 30 genes in the screen identifies the LPAR1-RAP1A axis as the most significant network among the gene candidates. E, Relative gene expression levels of LPAR1 in melanoma, NCLSC, and melanocytes assayed by qRT-PCR. Biological replicates (n = 3) for each condition are included.